Sample-level Deep Convolutional Neural Networks for Music Auto-tagging Using Raw Waveforms
We propose sample-level deep convolutional neural networks which learn representations from very small grains of waveforms (e.g. 2 or 3 samples) beyond typical frame-level input representations. In addition, we visualize filters learned in a sample-level DCNN in each layer to identify hierarchically learned features and show that they are sensitive to log-scaled frequency along layer, such as mel-frequency spectrogram that is widely used in music classification systems.
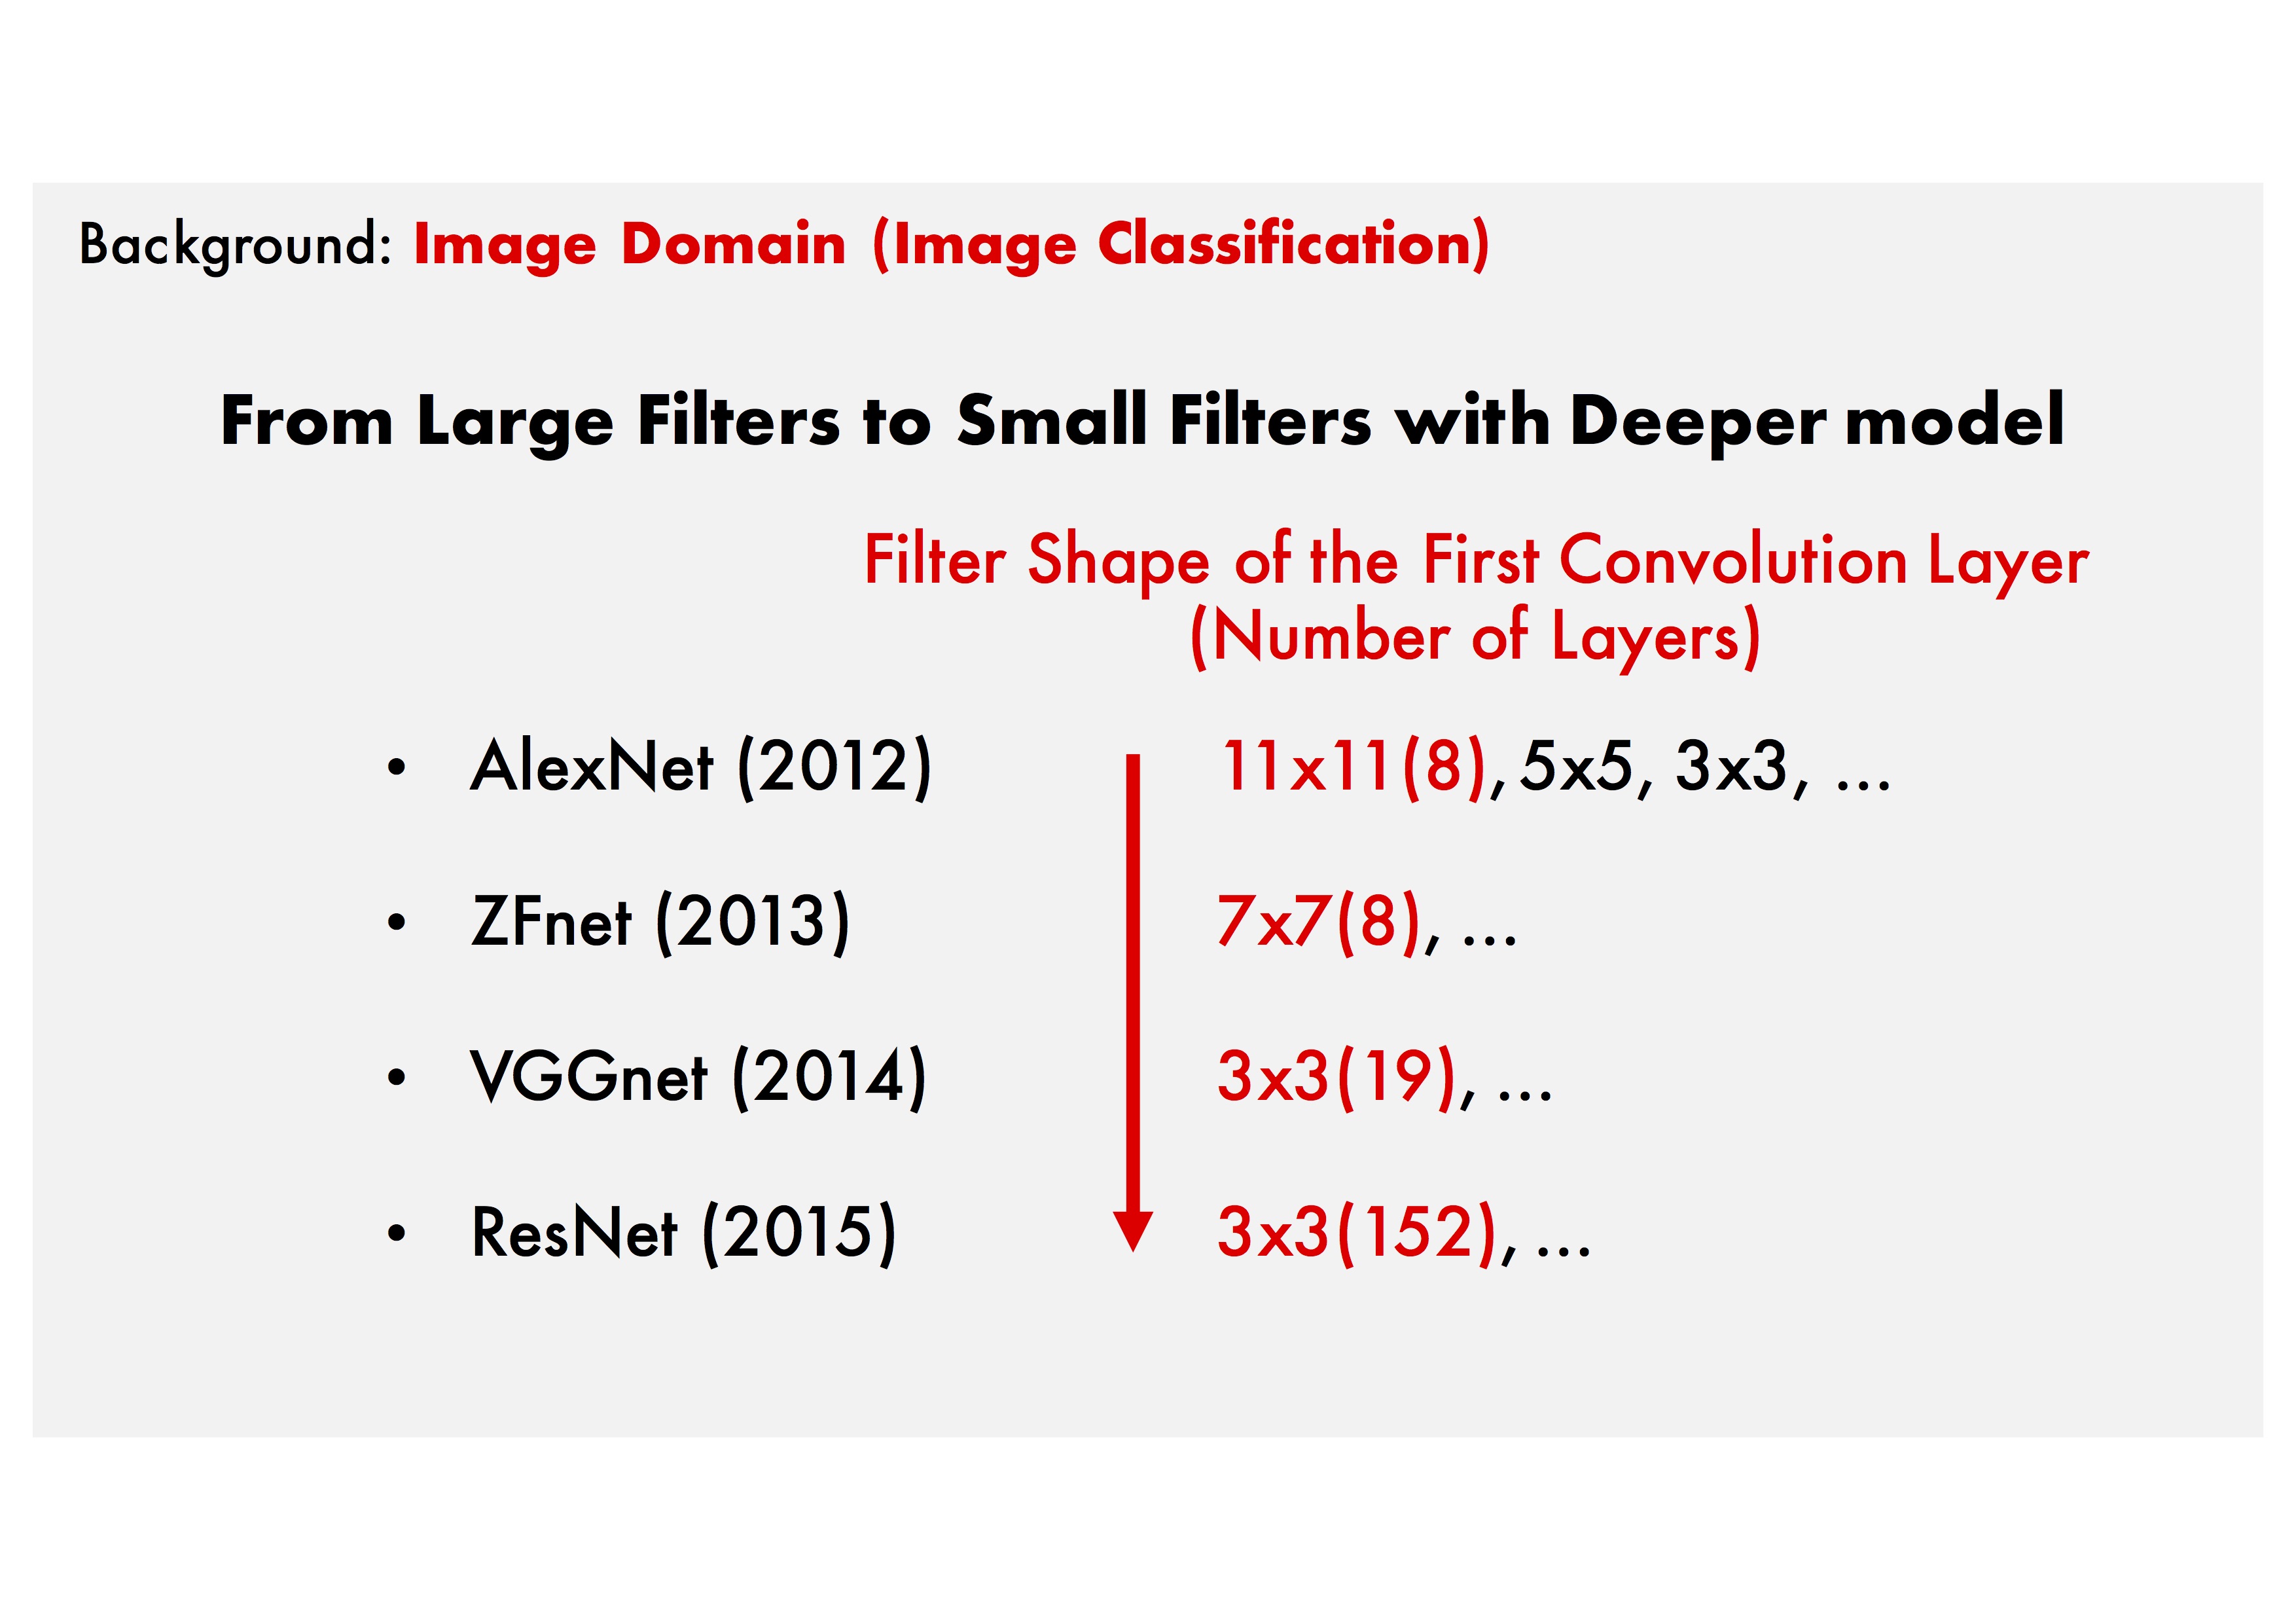
Background: Learning from raw data in the image domain.
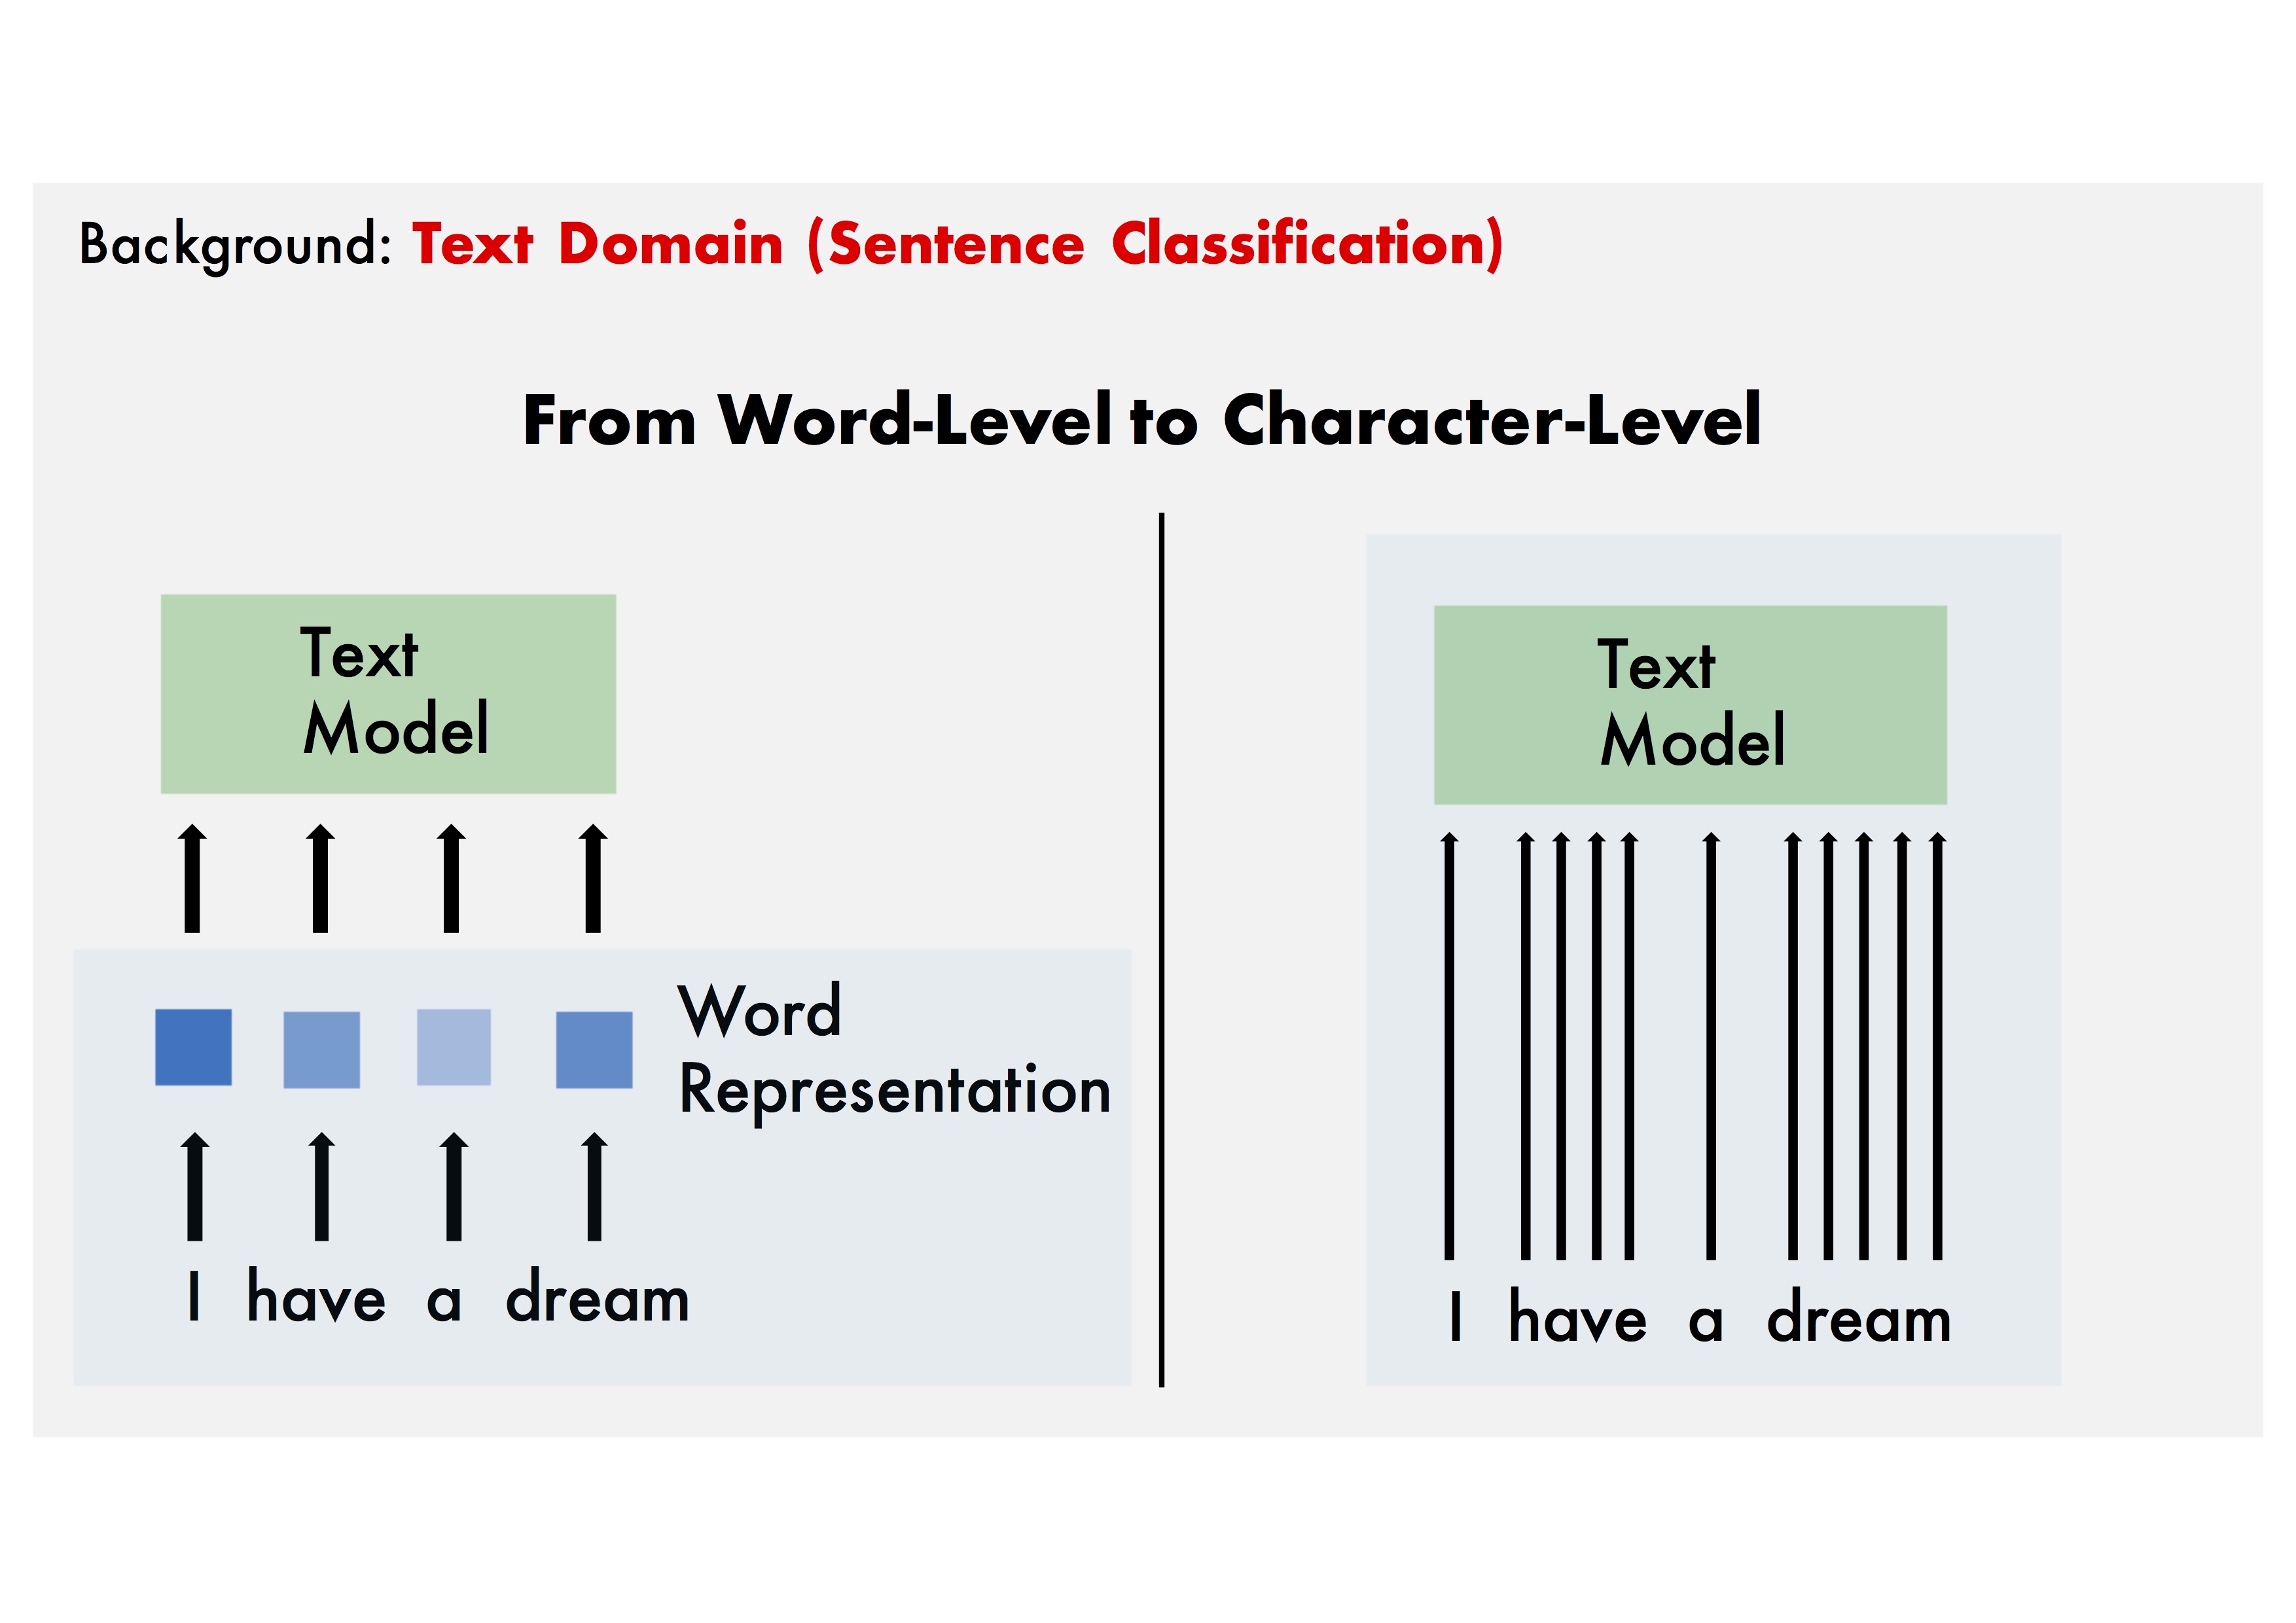
Background: Learning from raw data in the text domain.
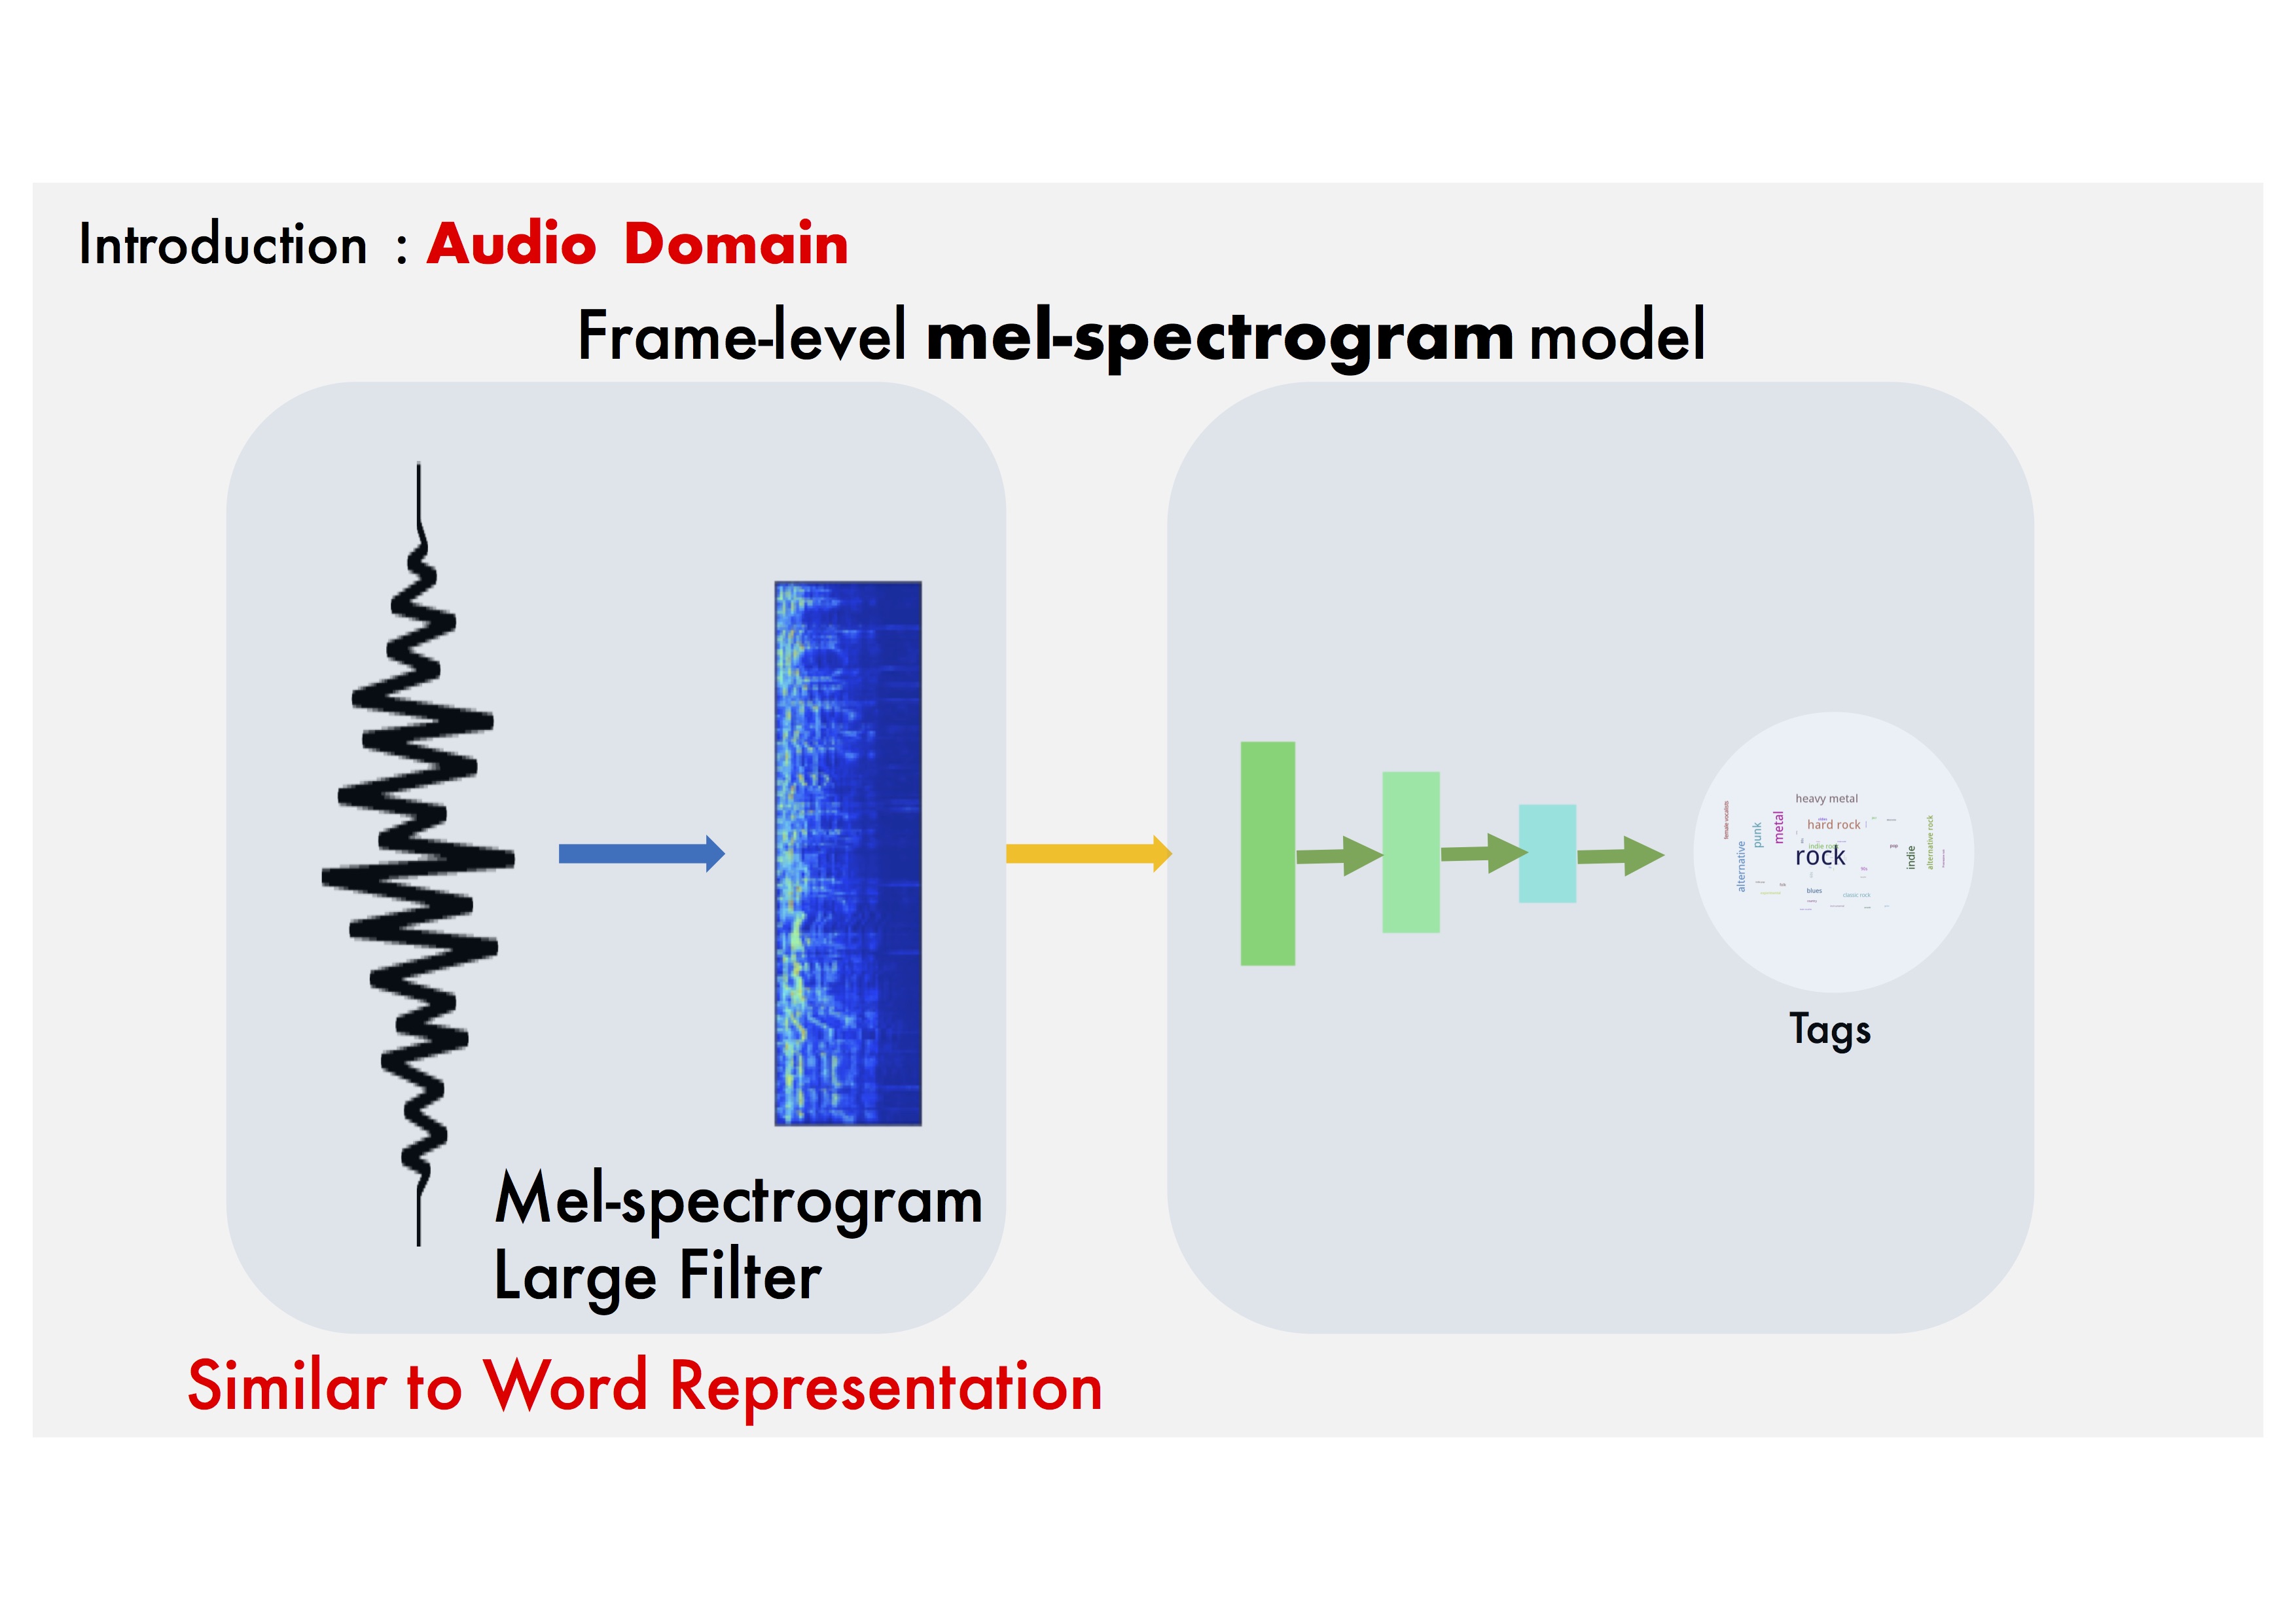
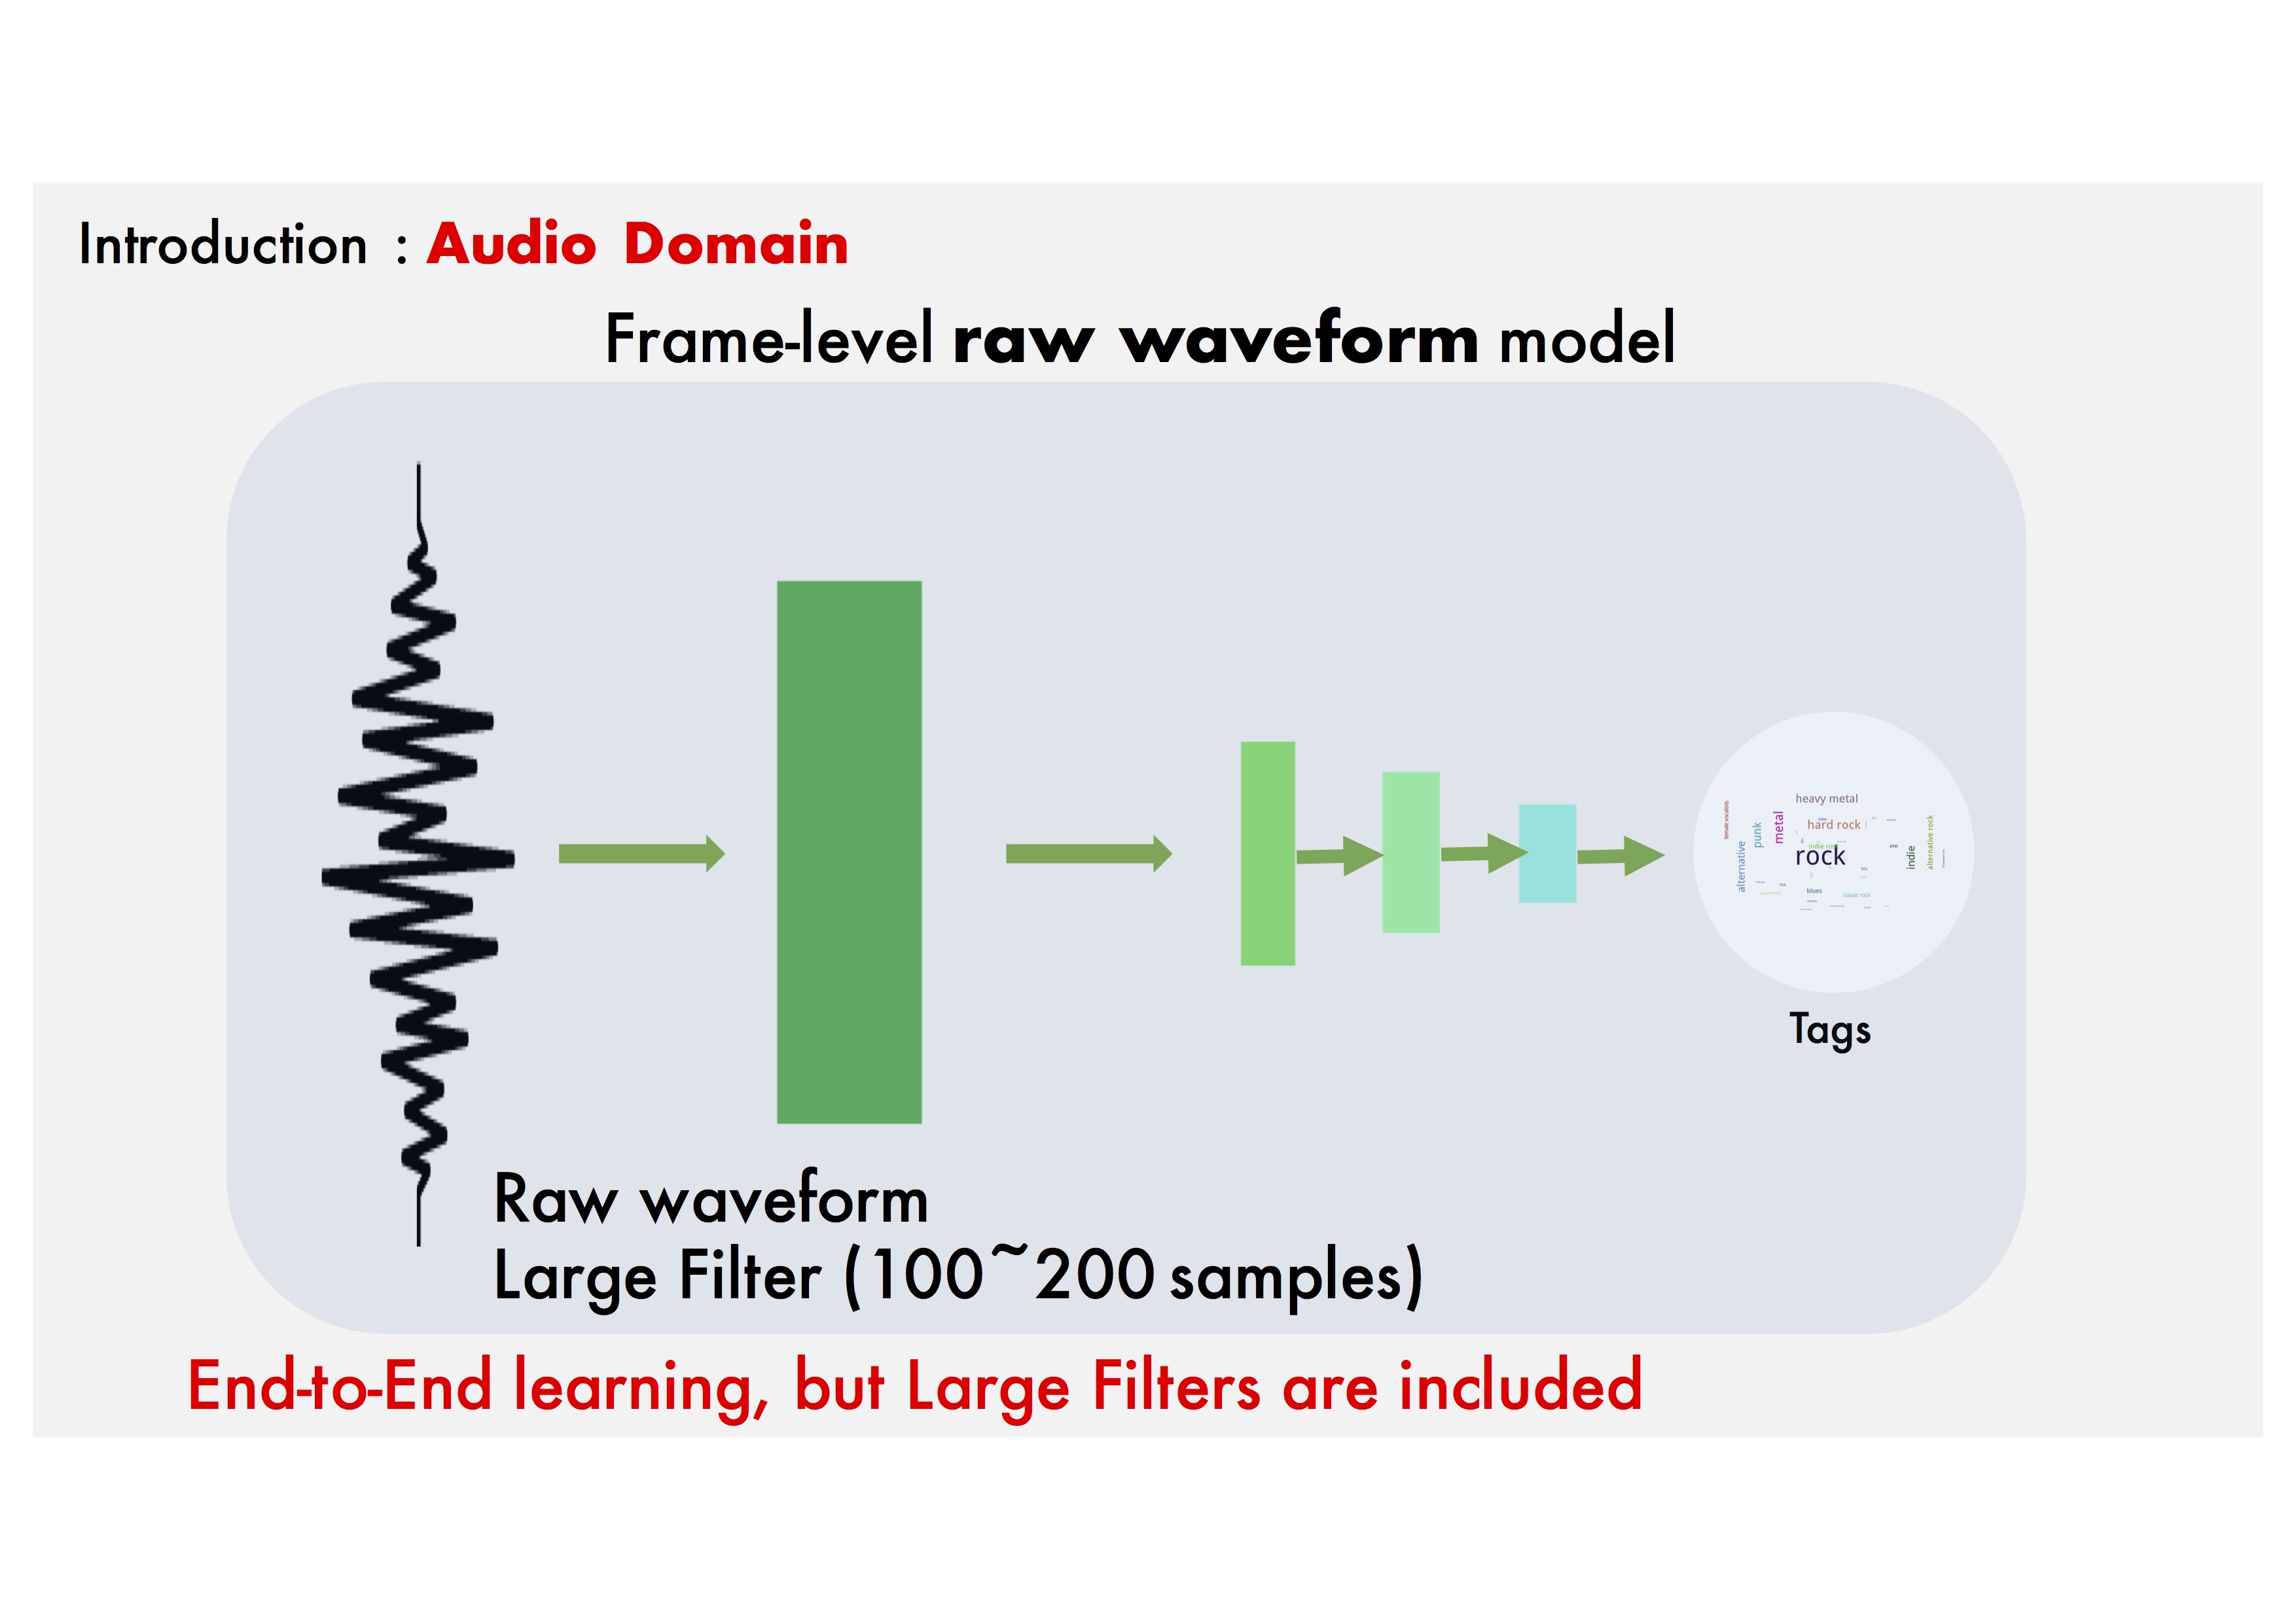
Background: Learning from raw data in the audio domain.
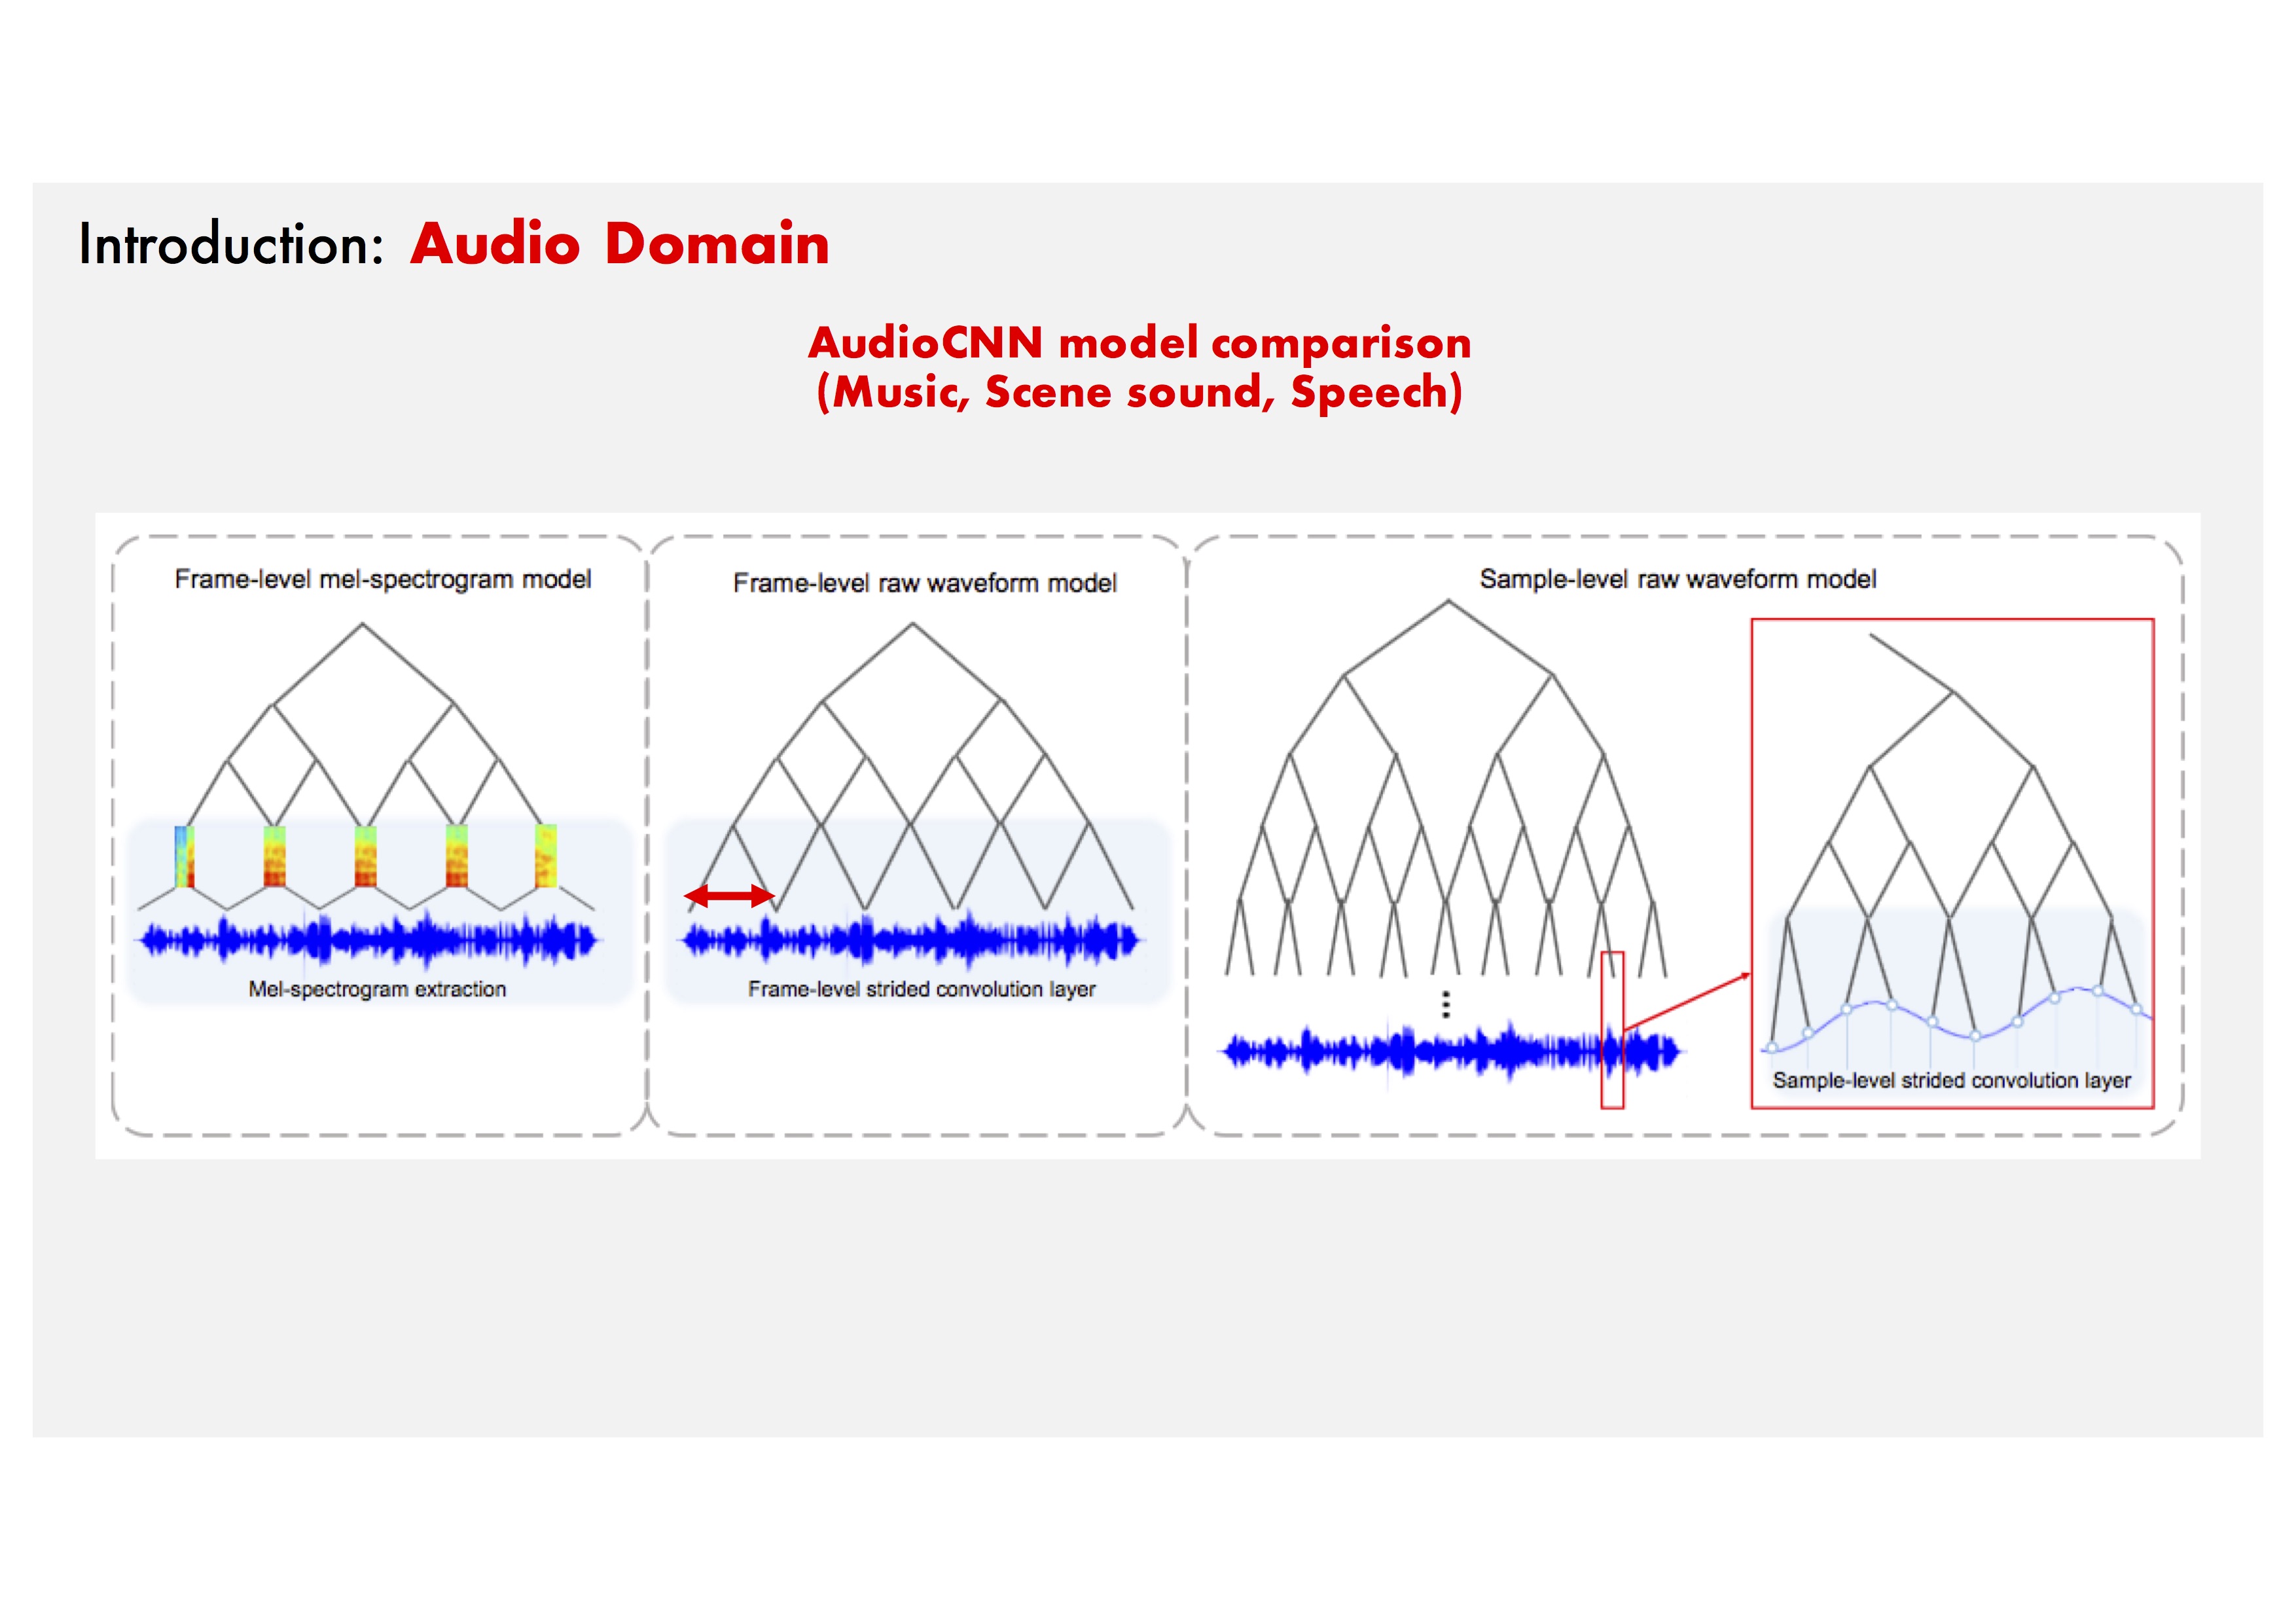
Frame-level Mel-spectrogram model: Mel-spectrograms are powerful, but this process is separated from the training phase.
Frame-level Raw waveform model: Previous studies have attempted to replace the Mel-spectrogram stage with Single Large filter CNN layer.
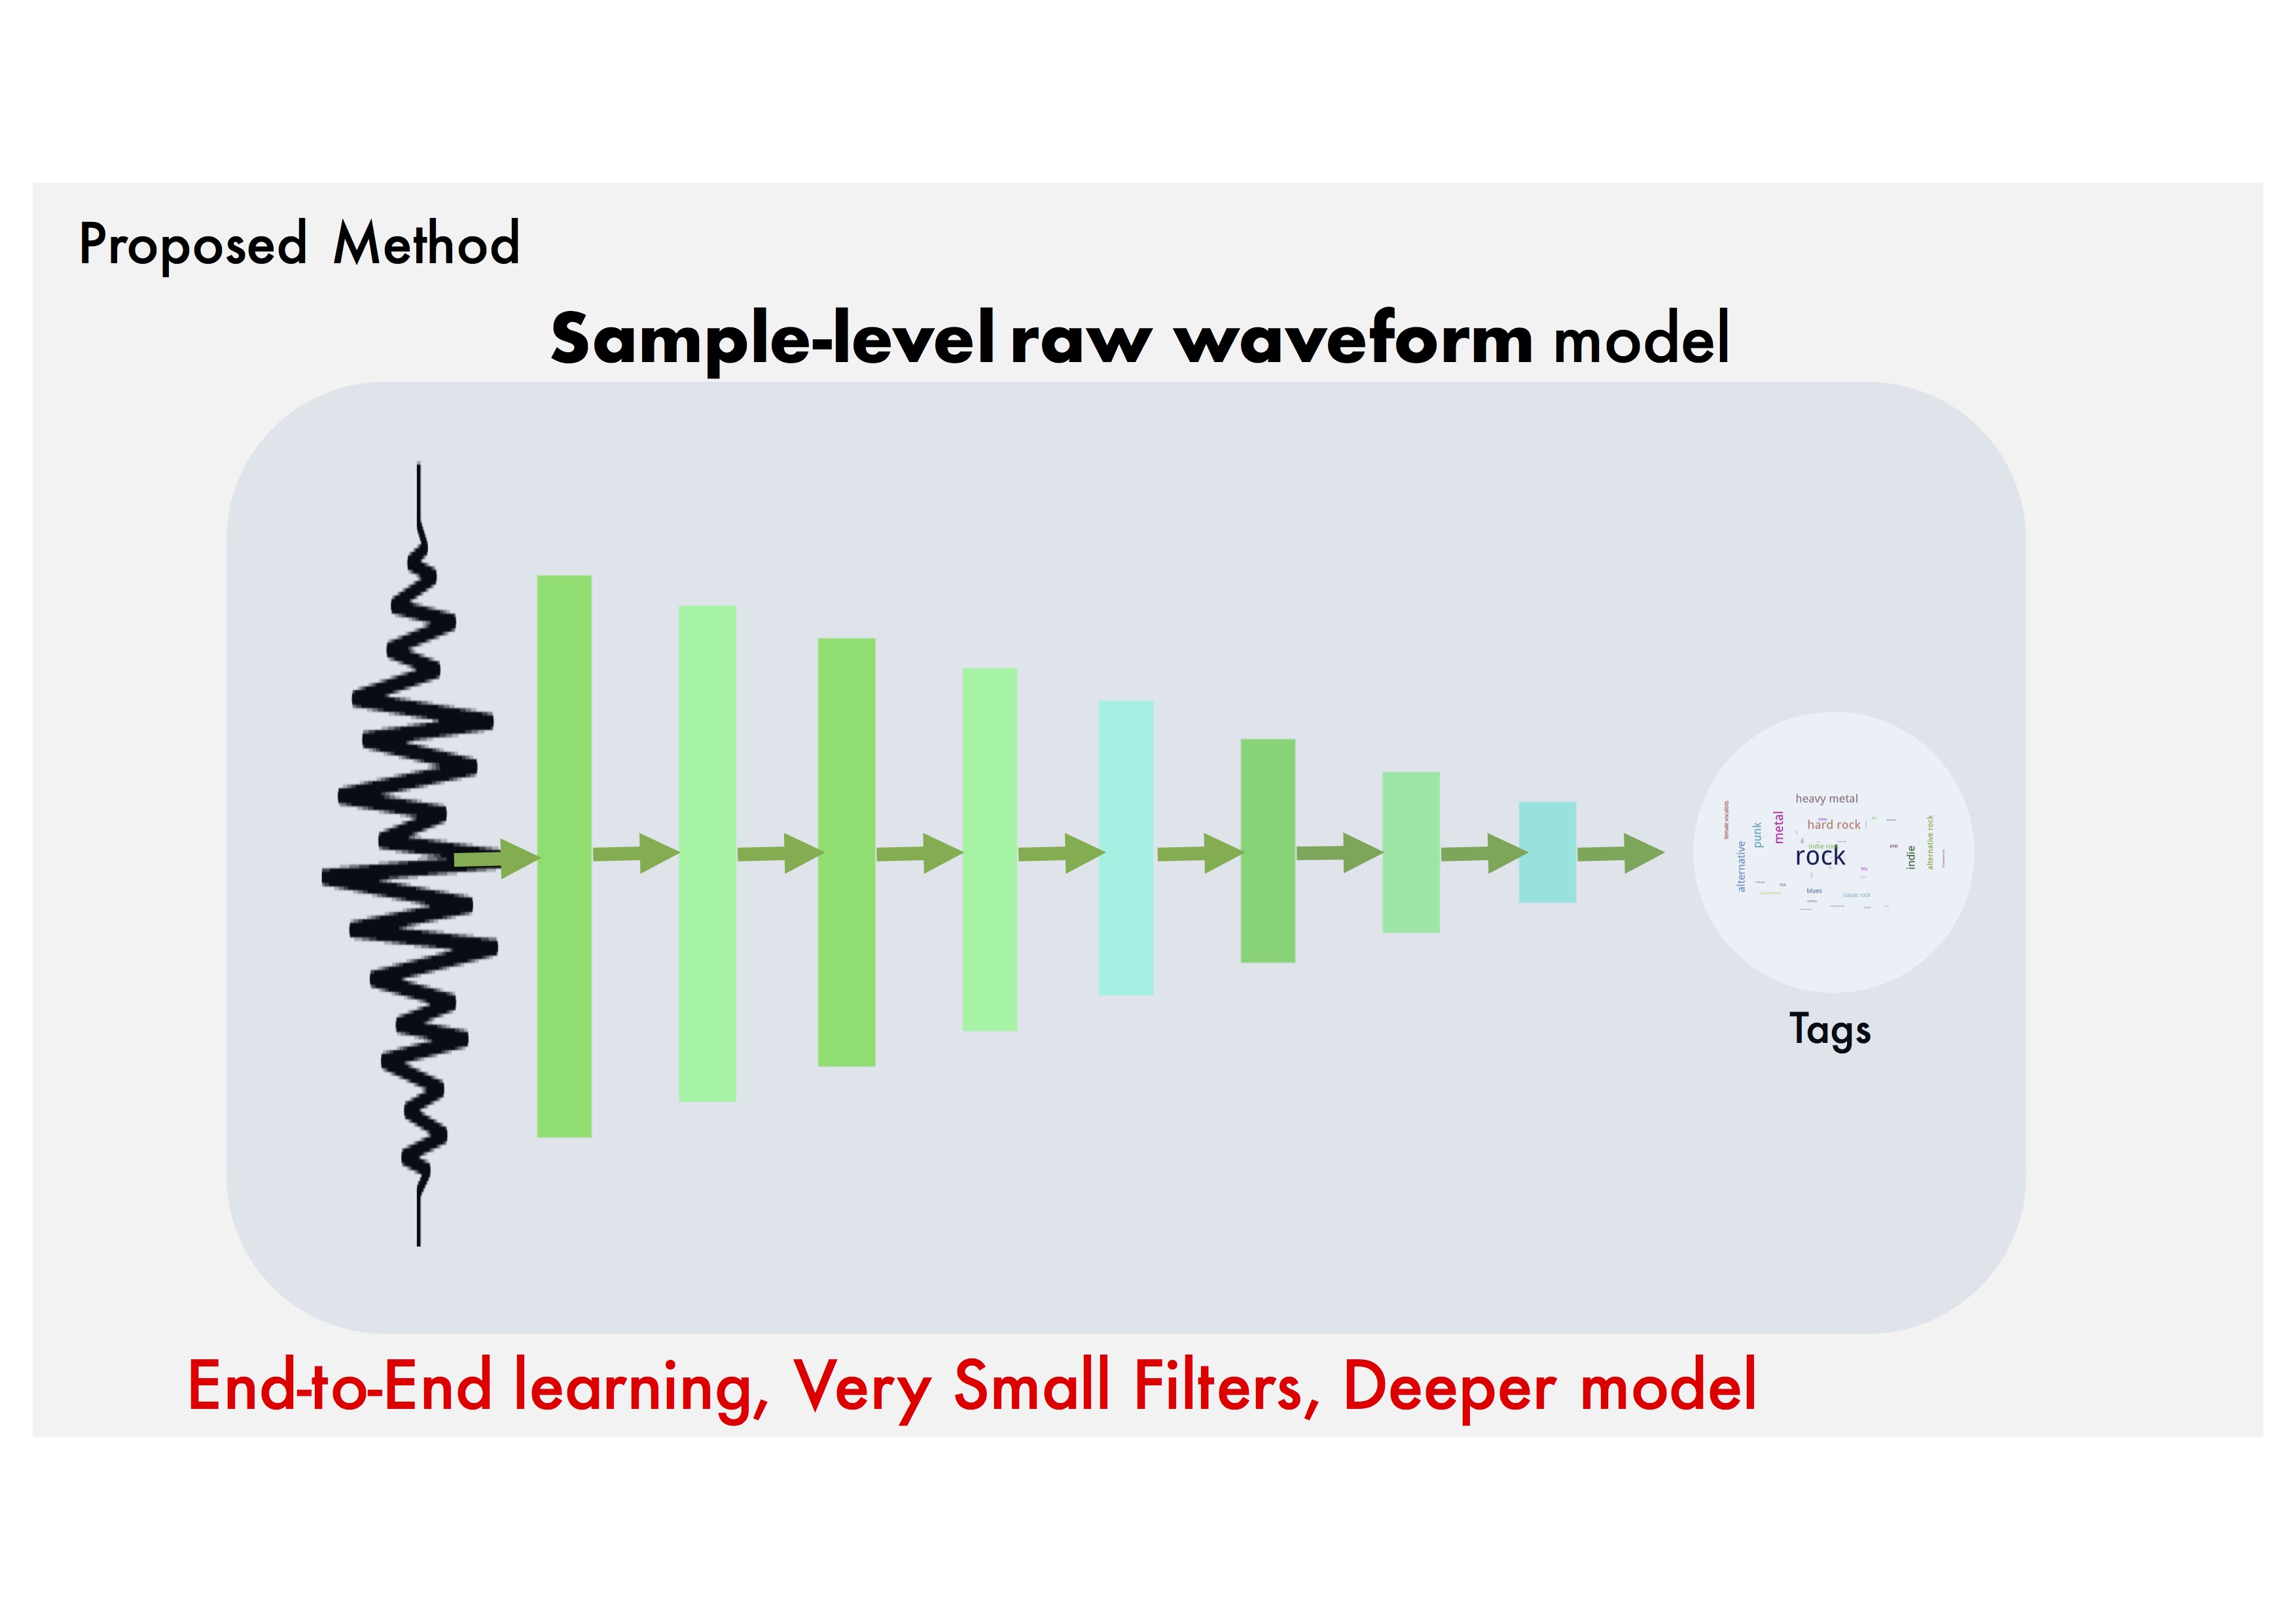
Sample-level Raw waveform model: Let's use a deeper CNN with small filters.
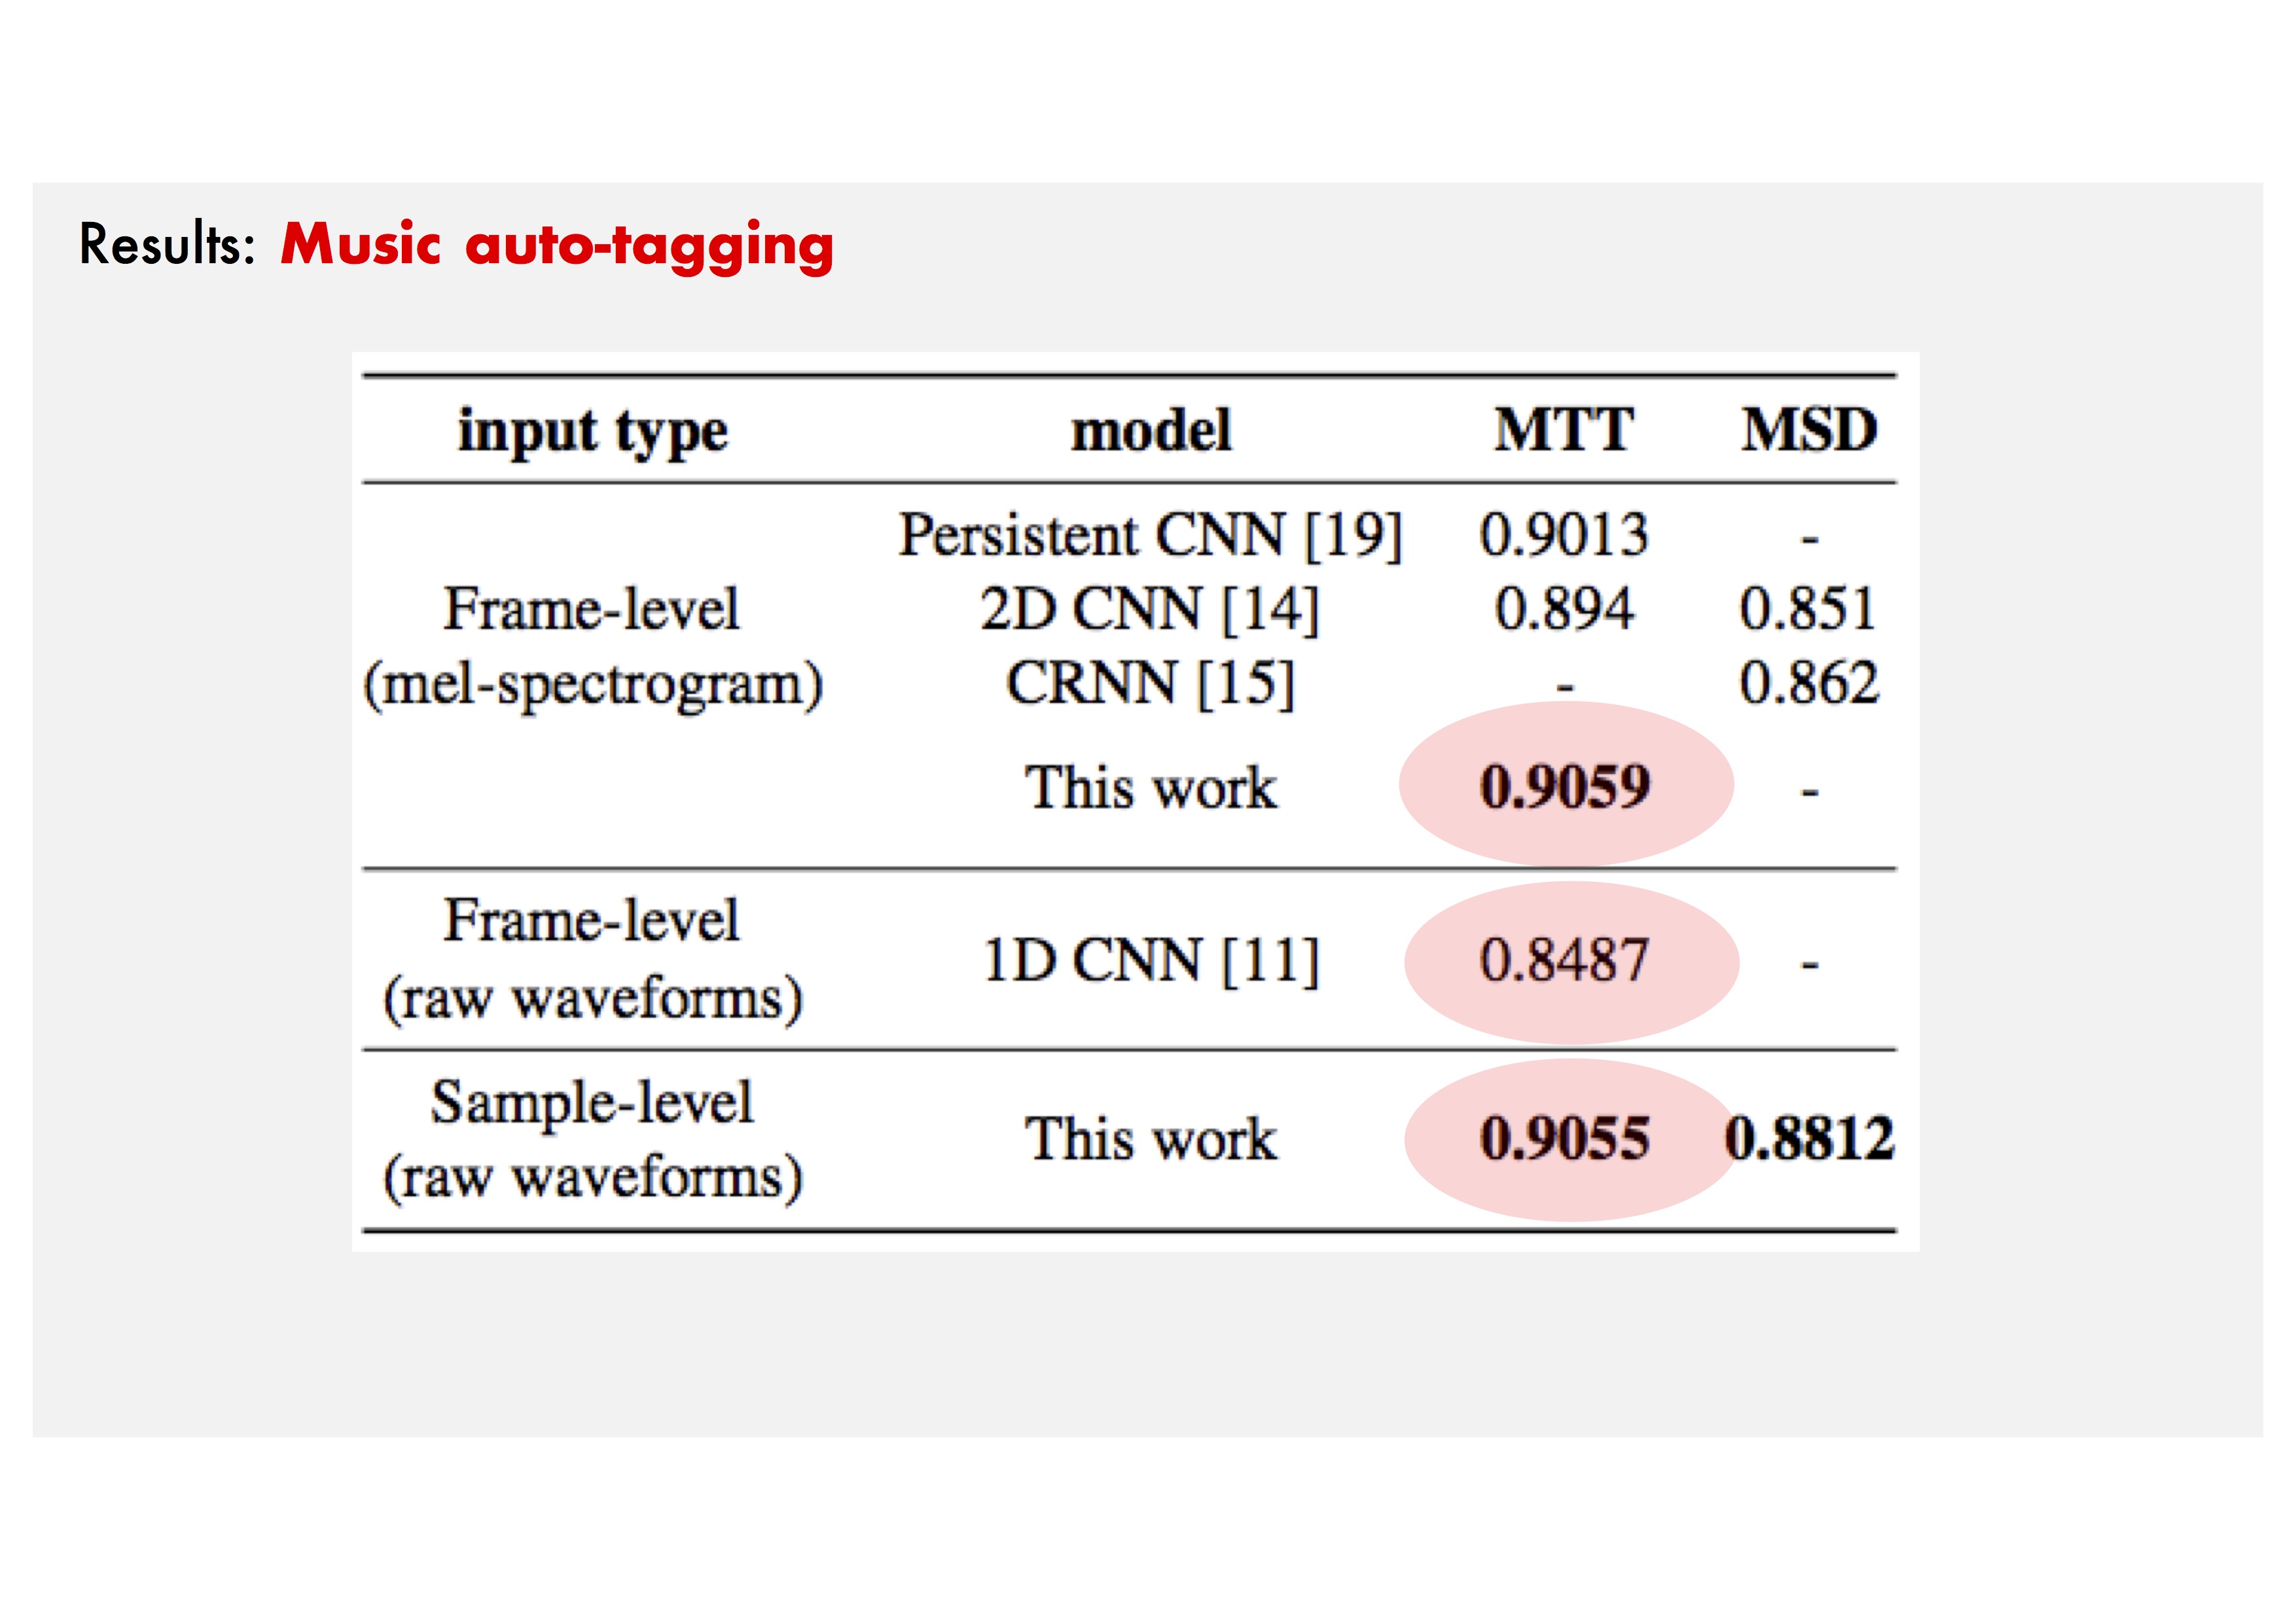
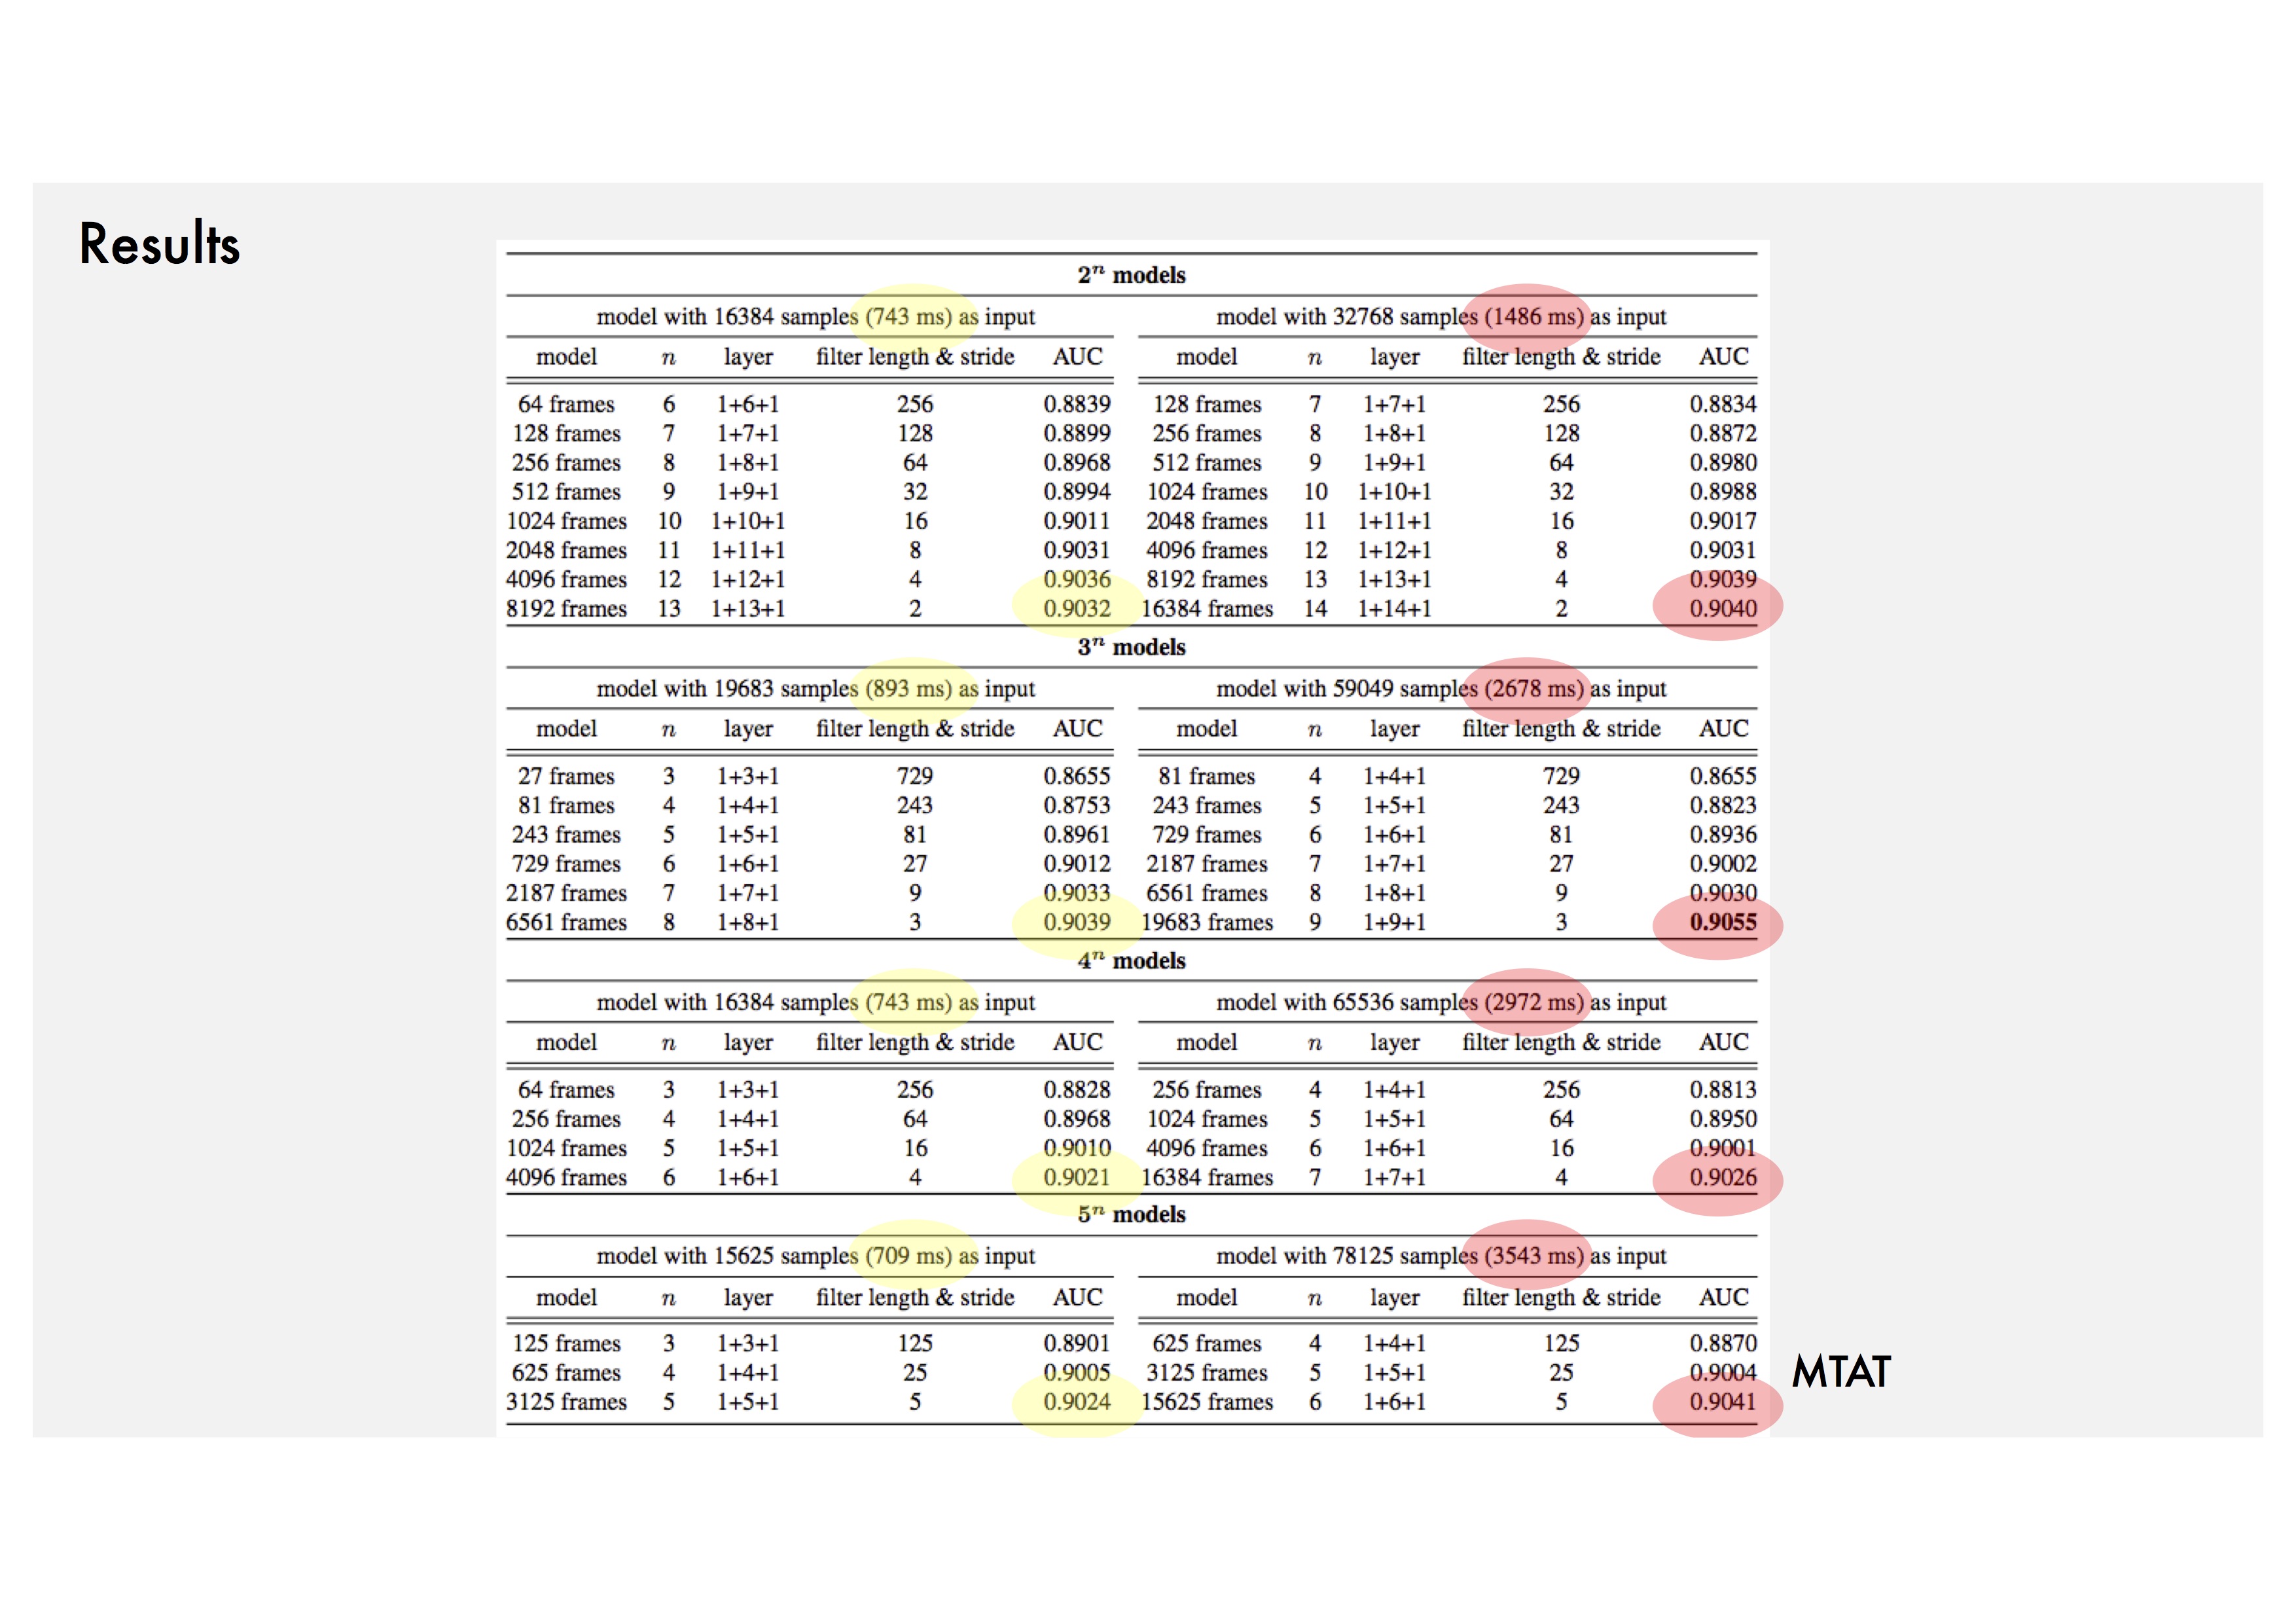
Comparison: Results of three comparative models.
Trend 1: Small filters with small strides of the first convolution layer.
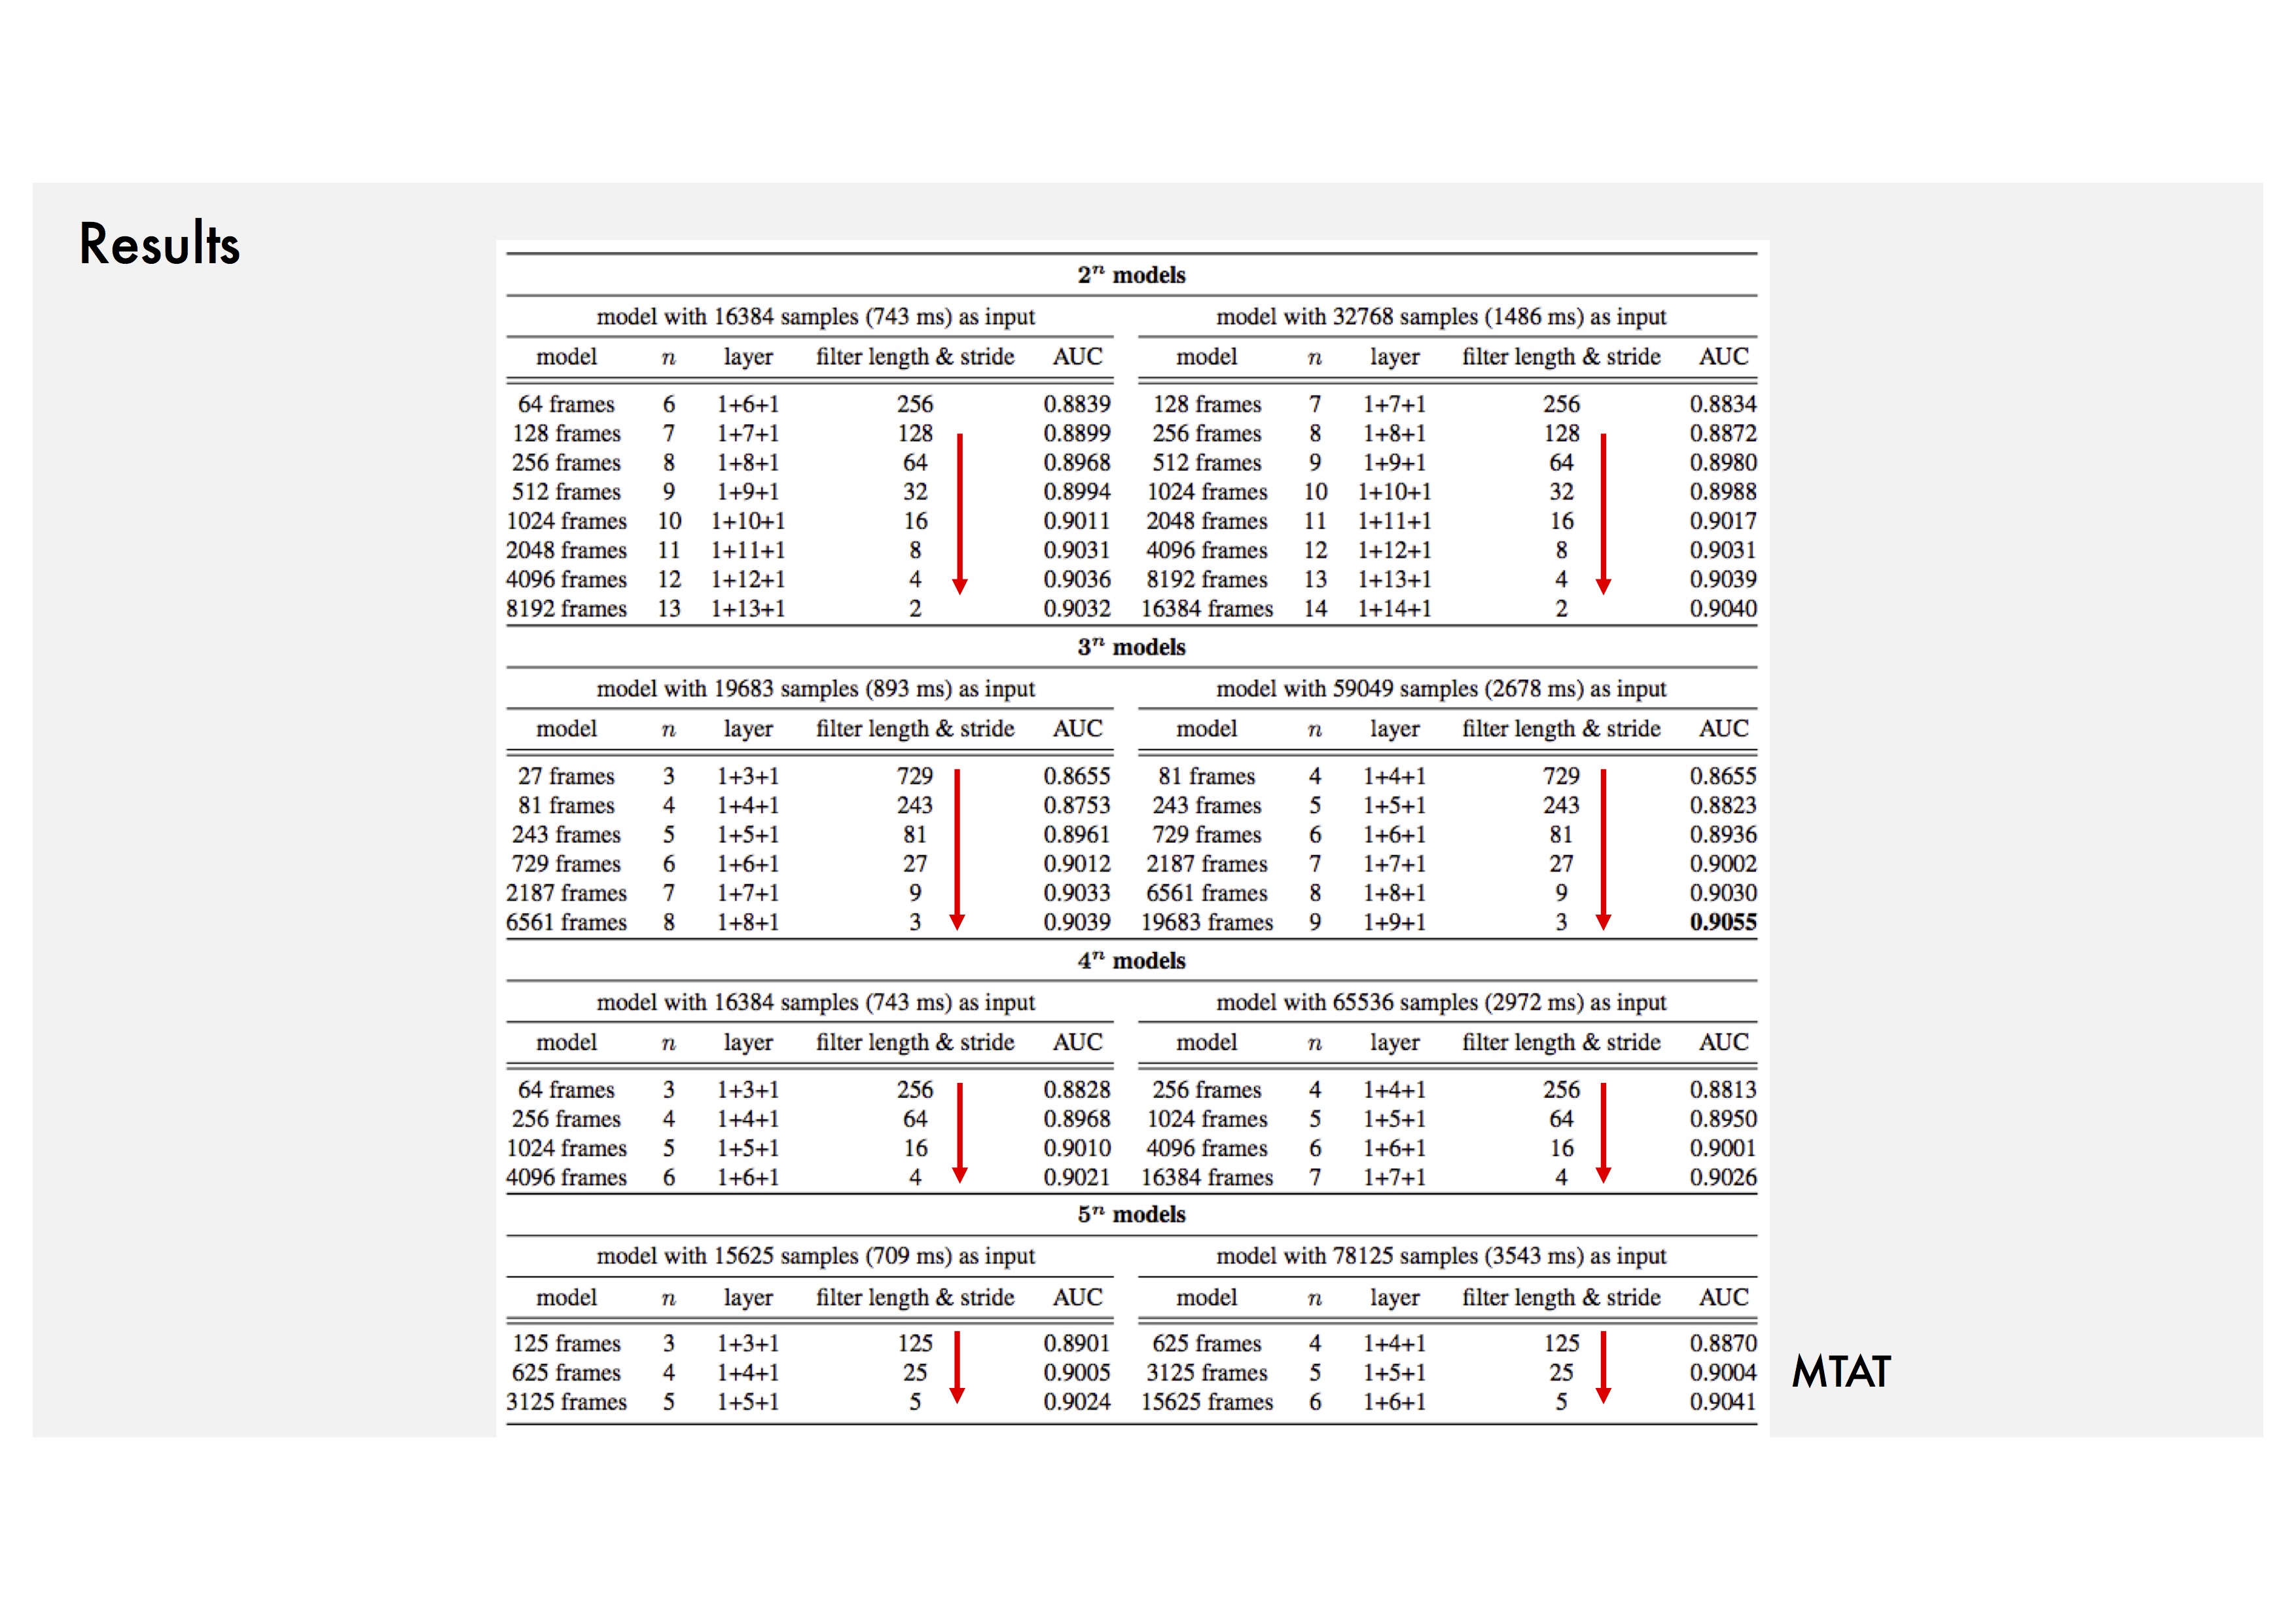
Trend 2: Deeper models (about 10 layers or more).
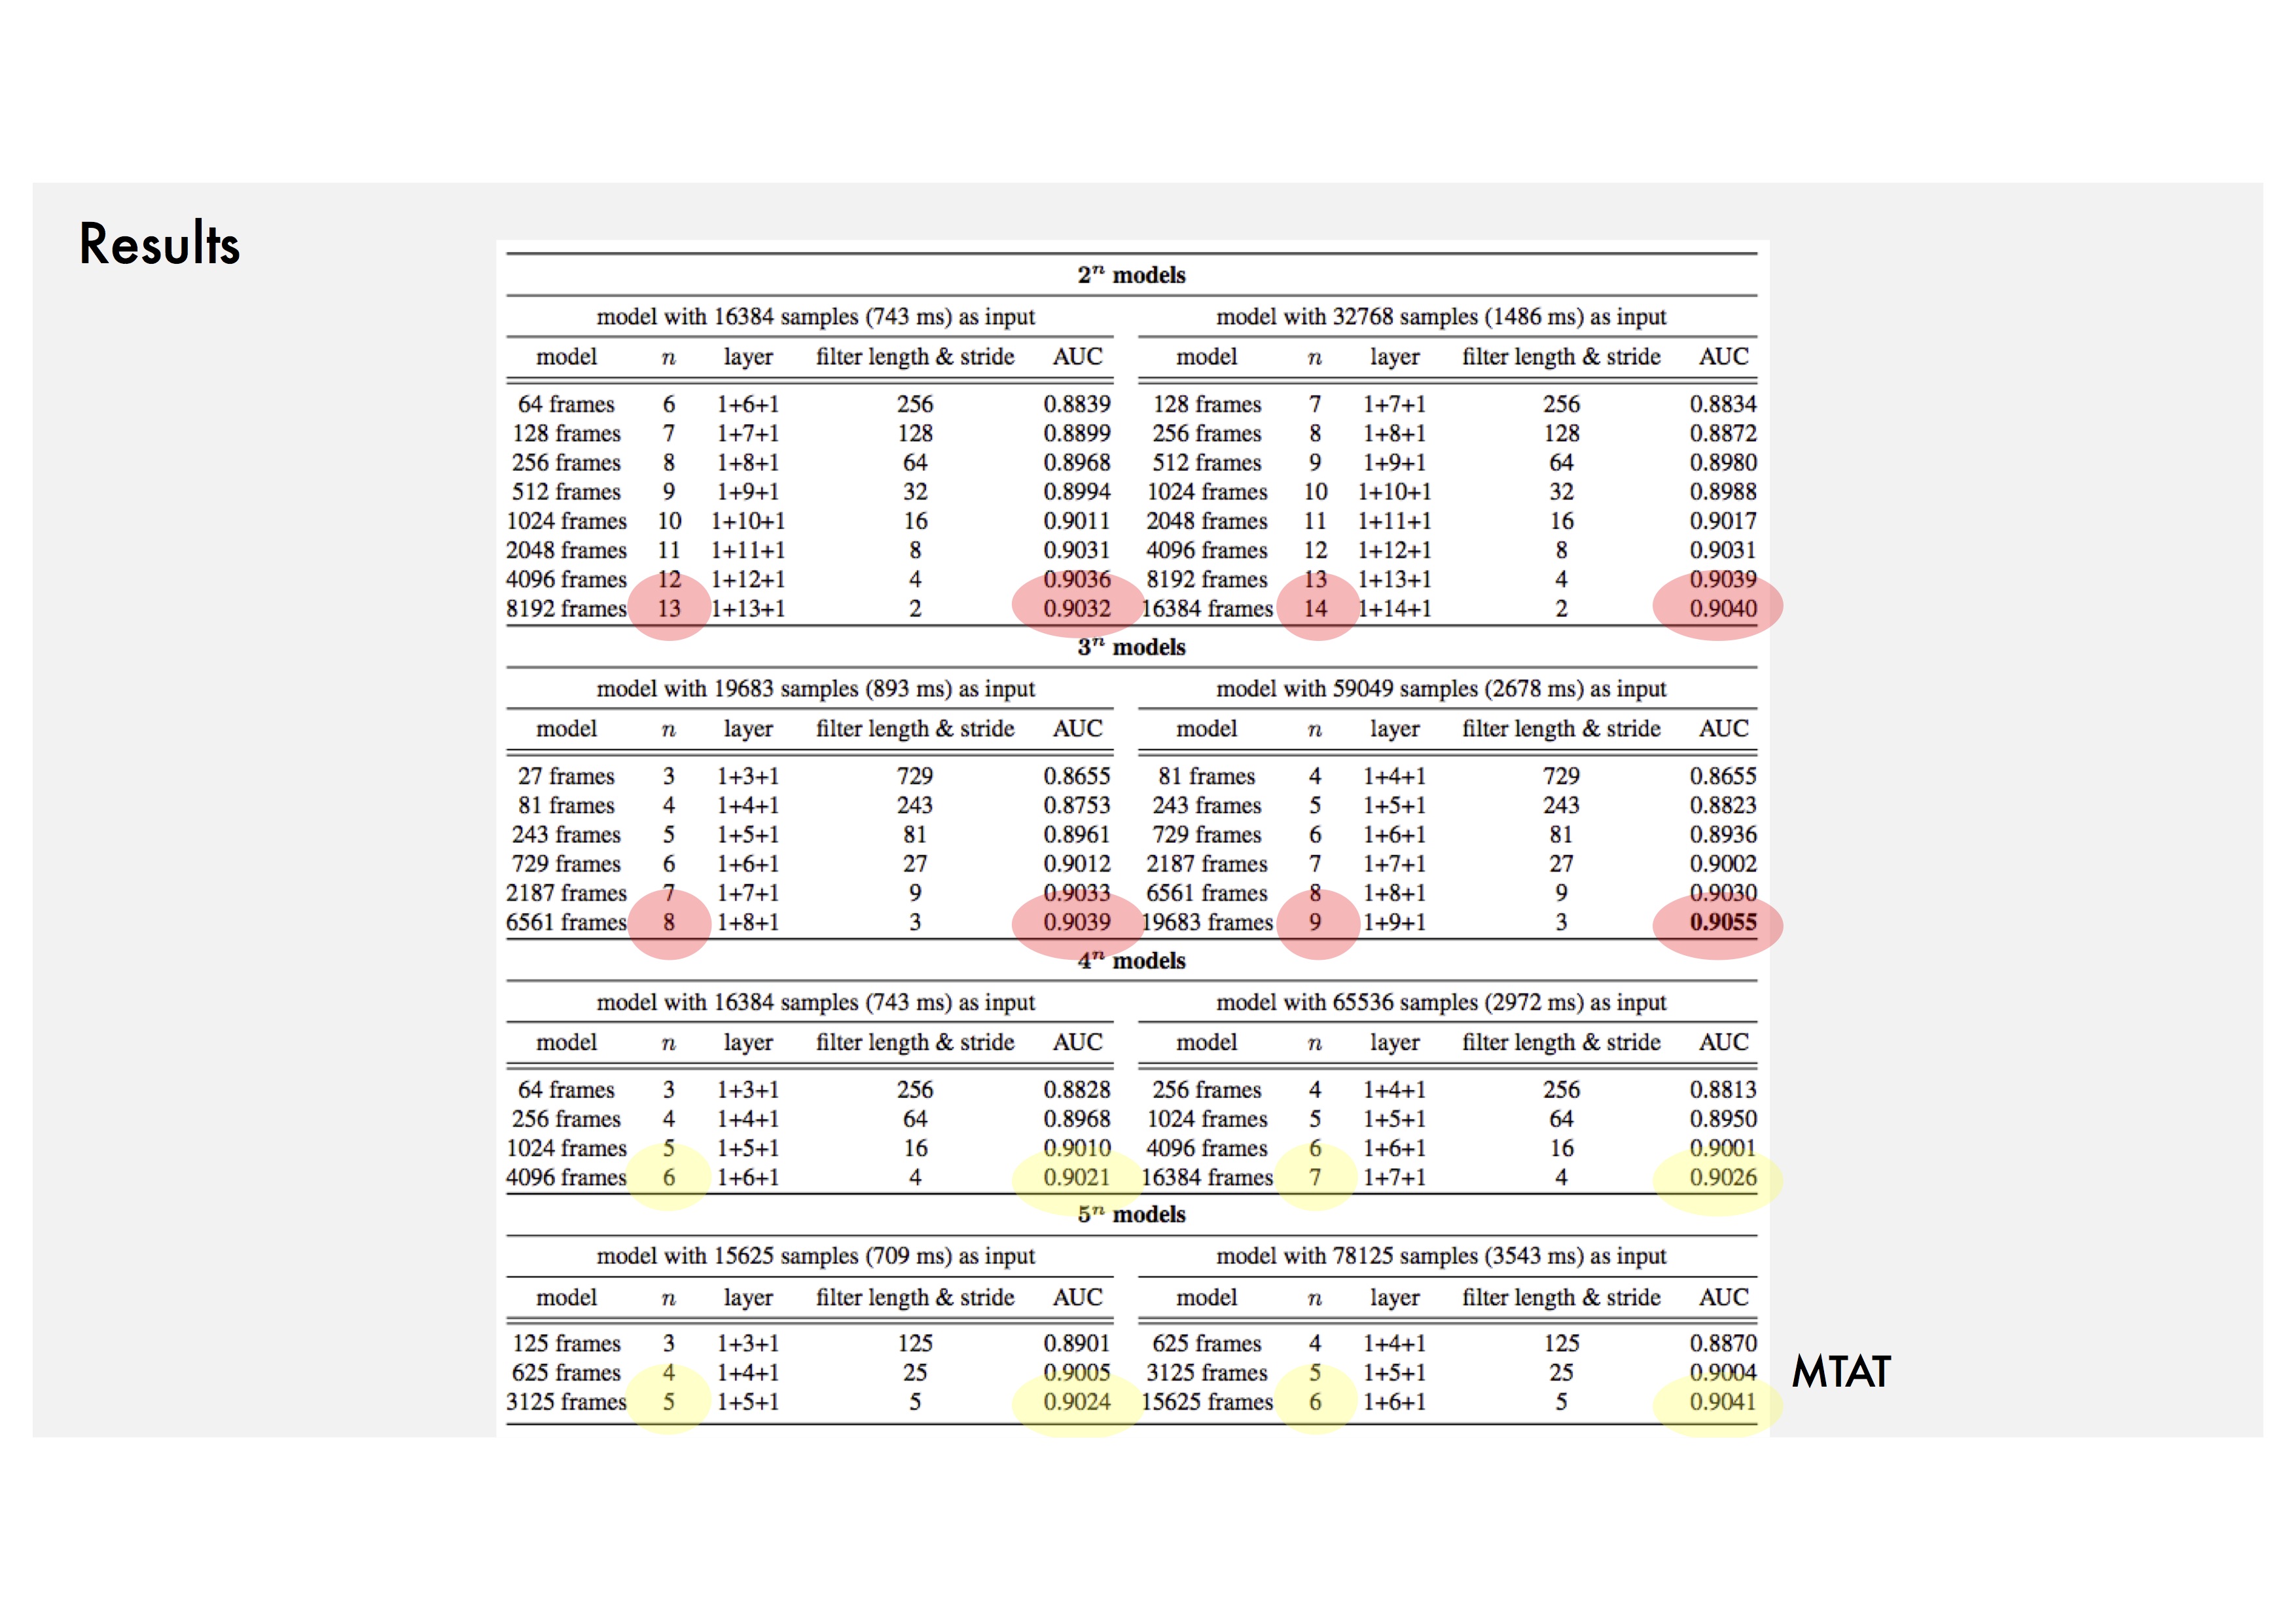
Trend 3: 1-5 seconds network input.
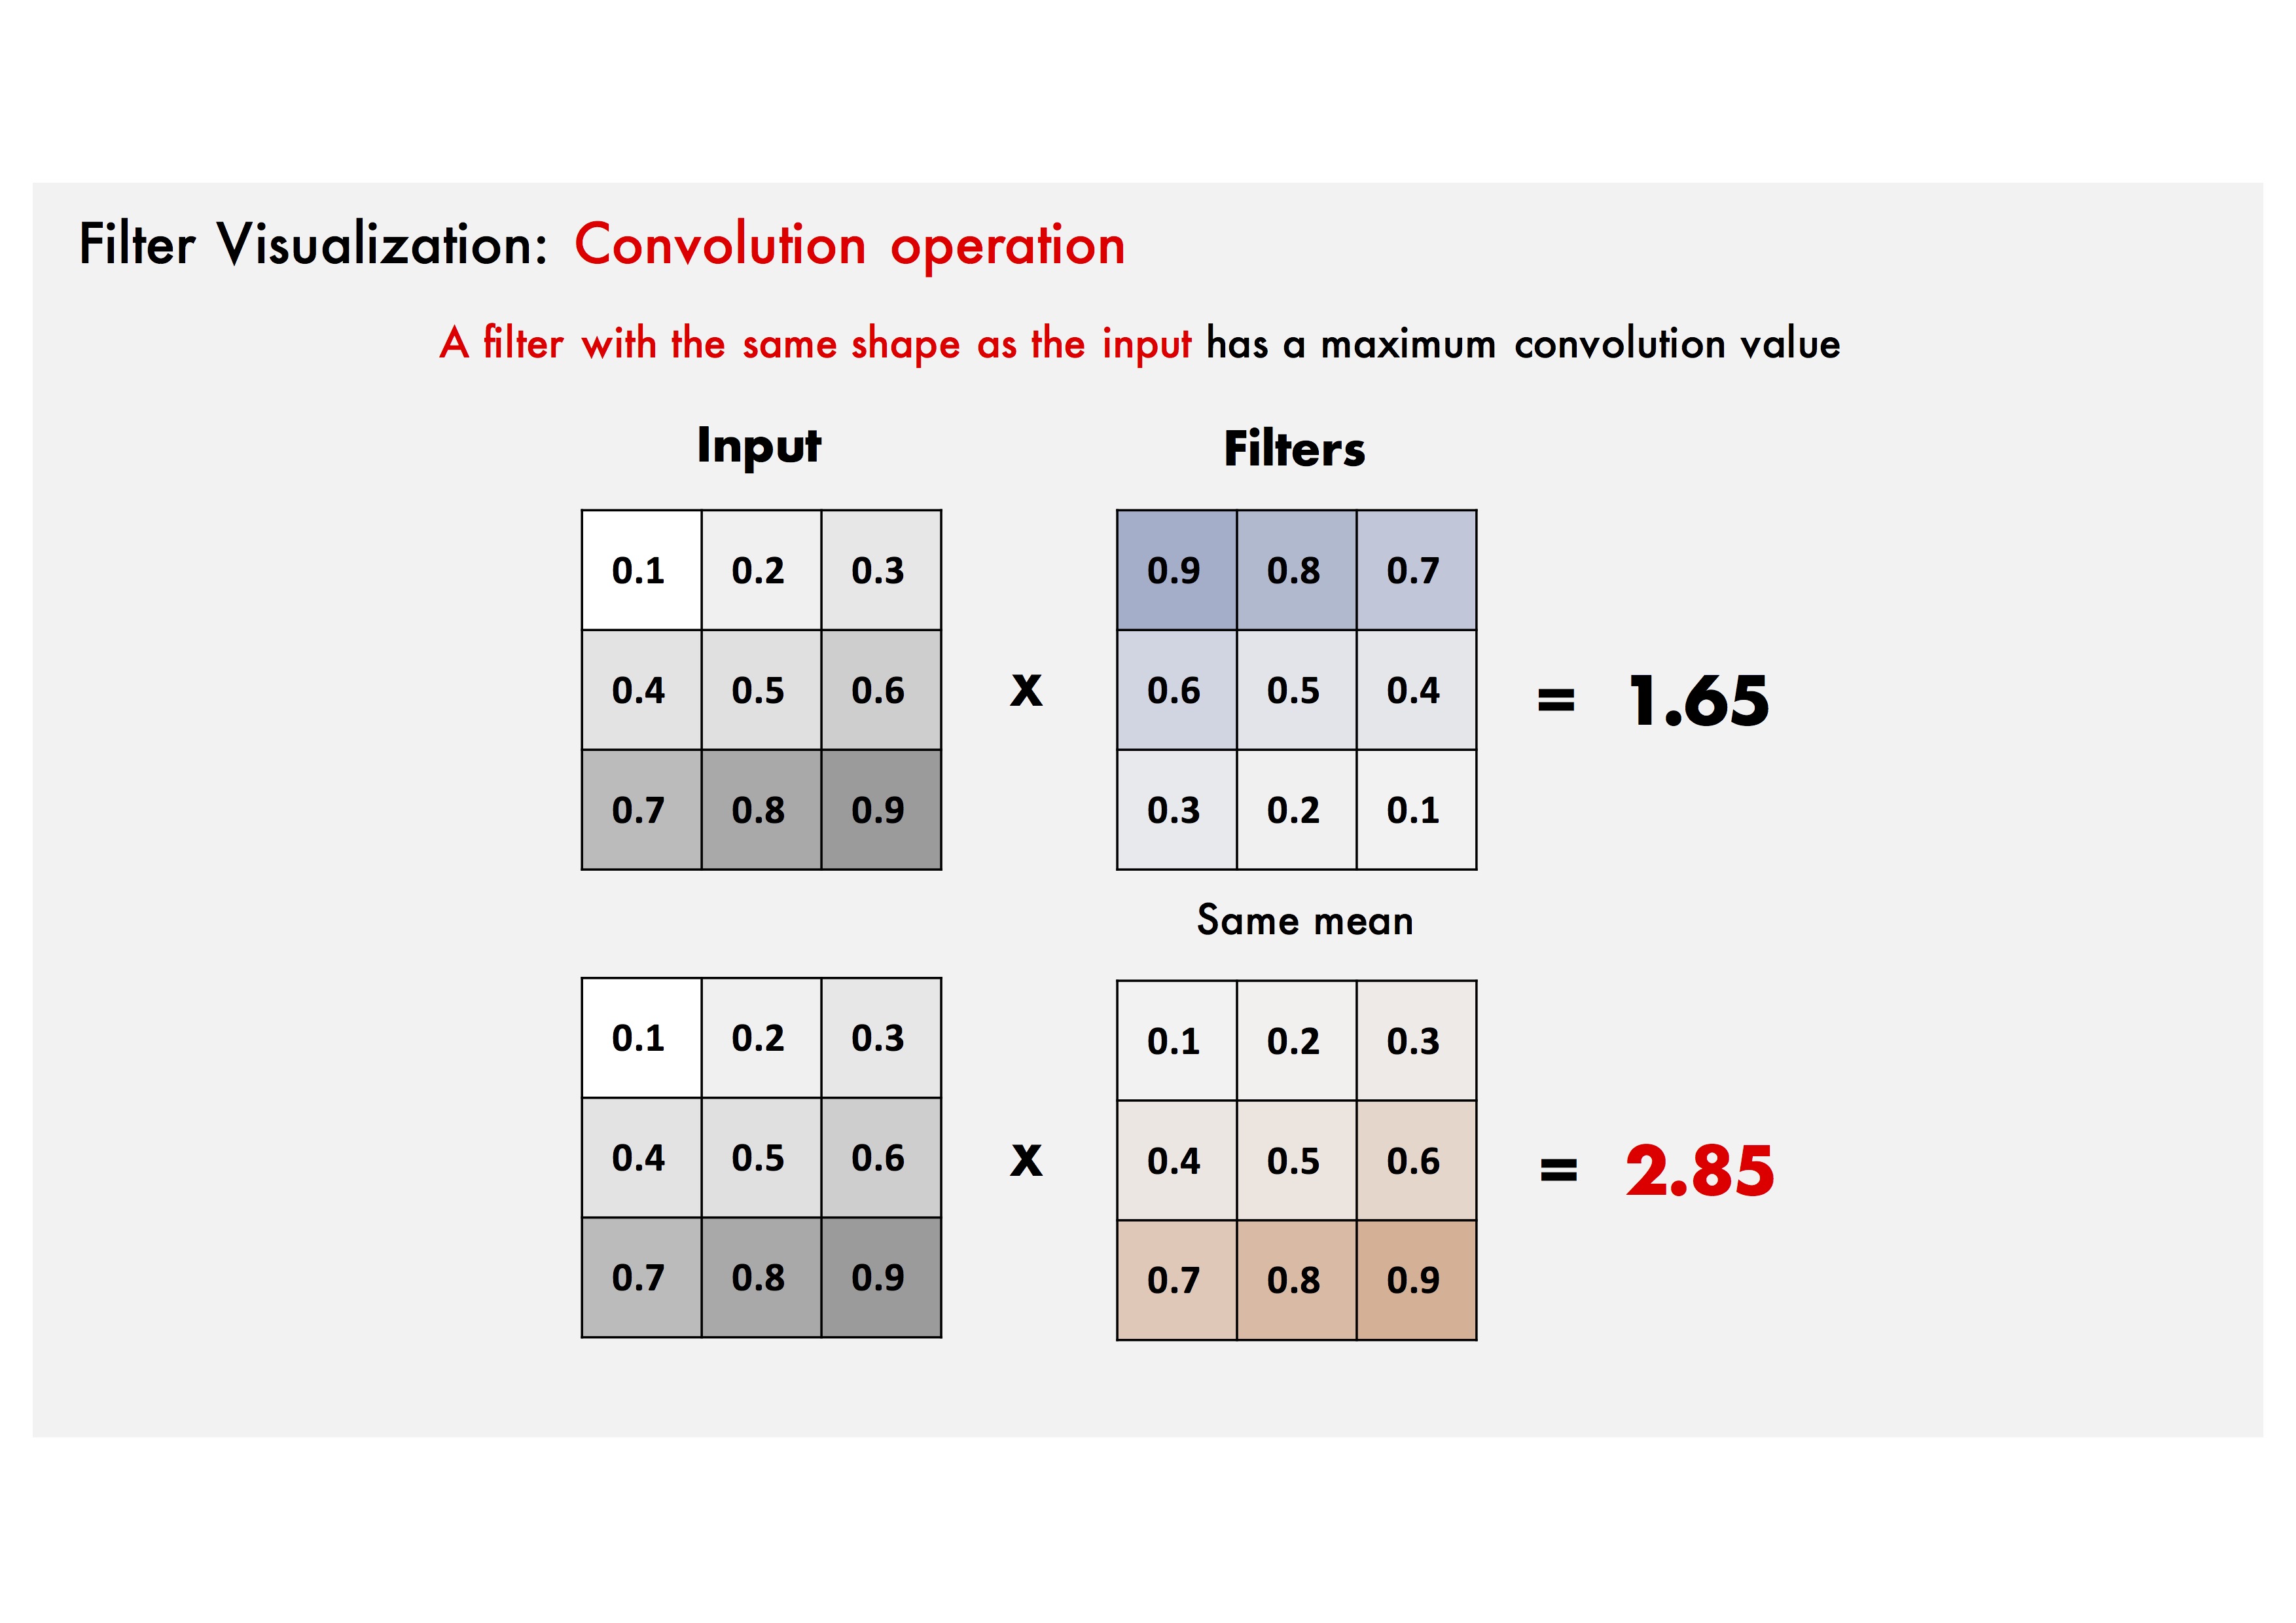
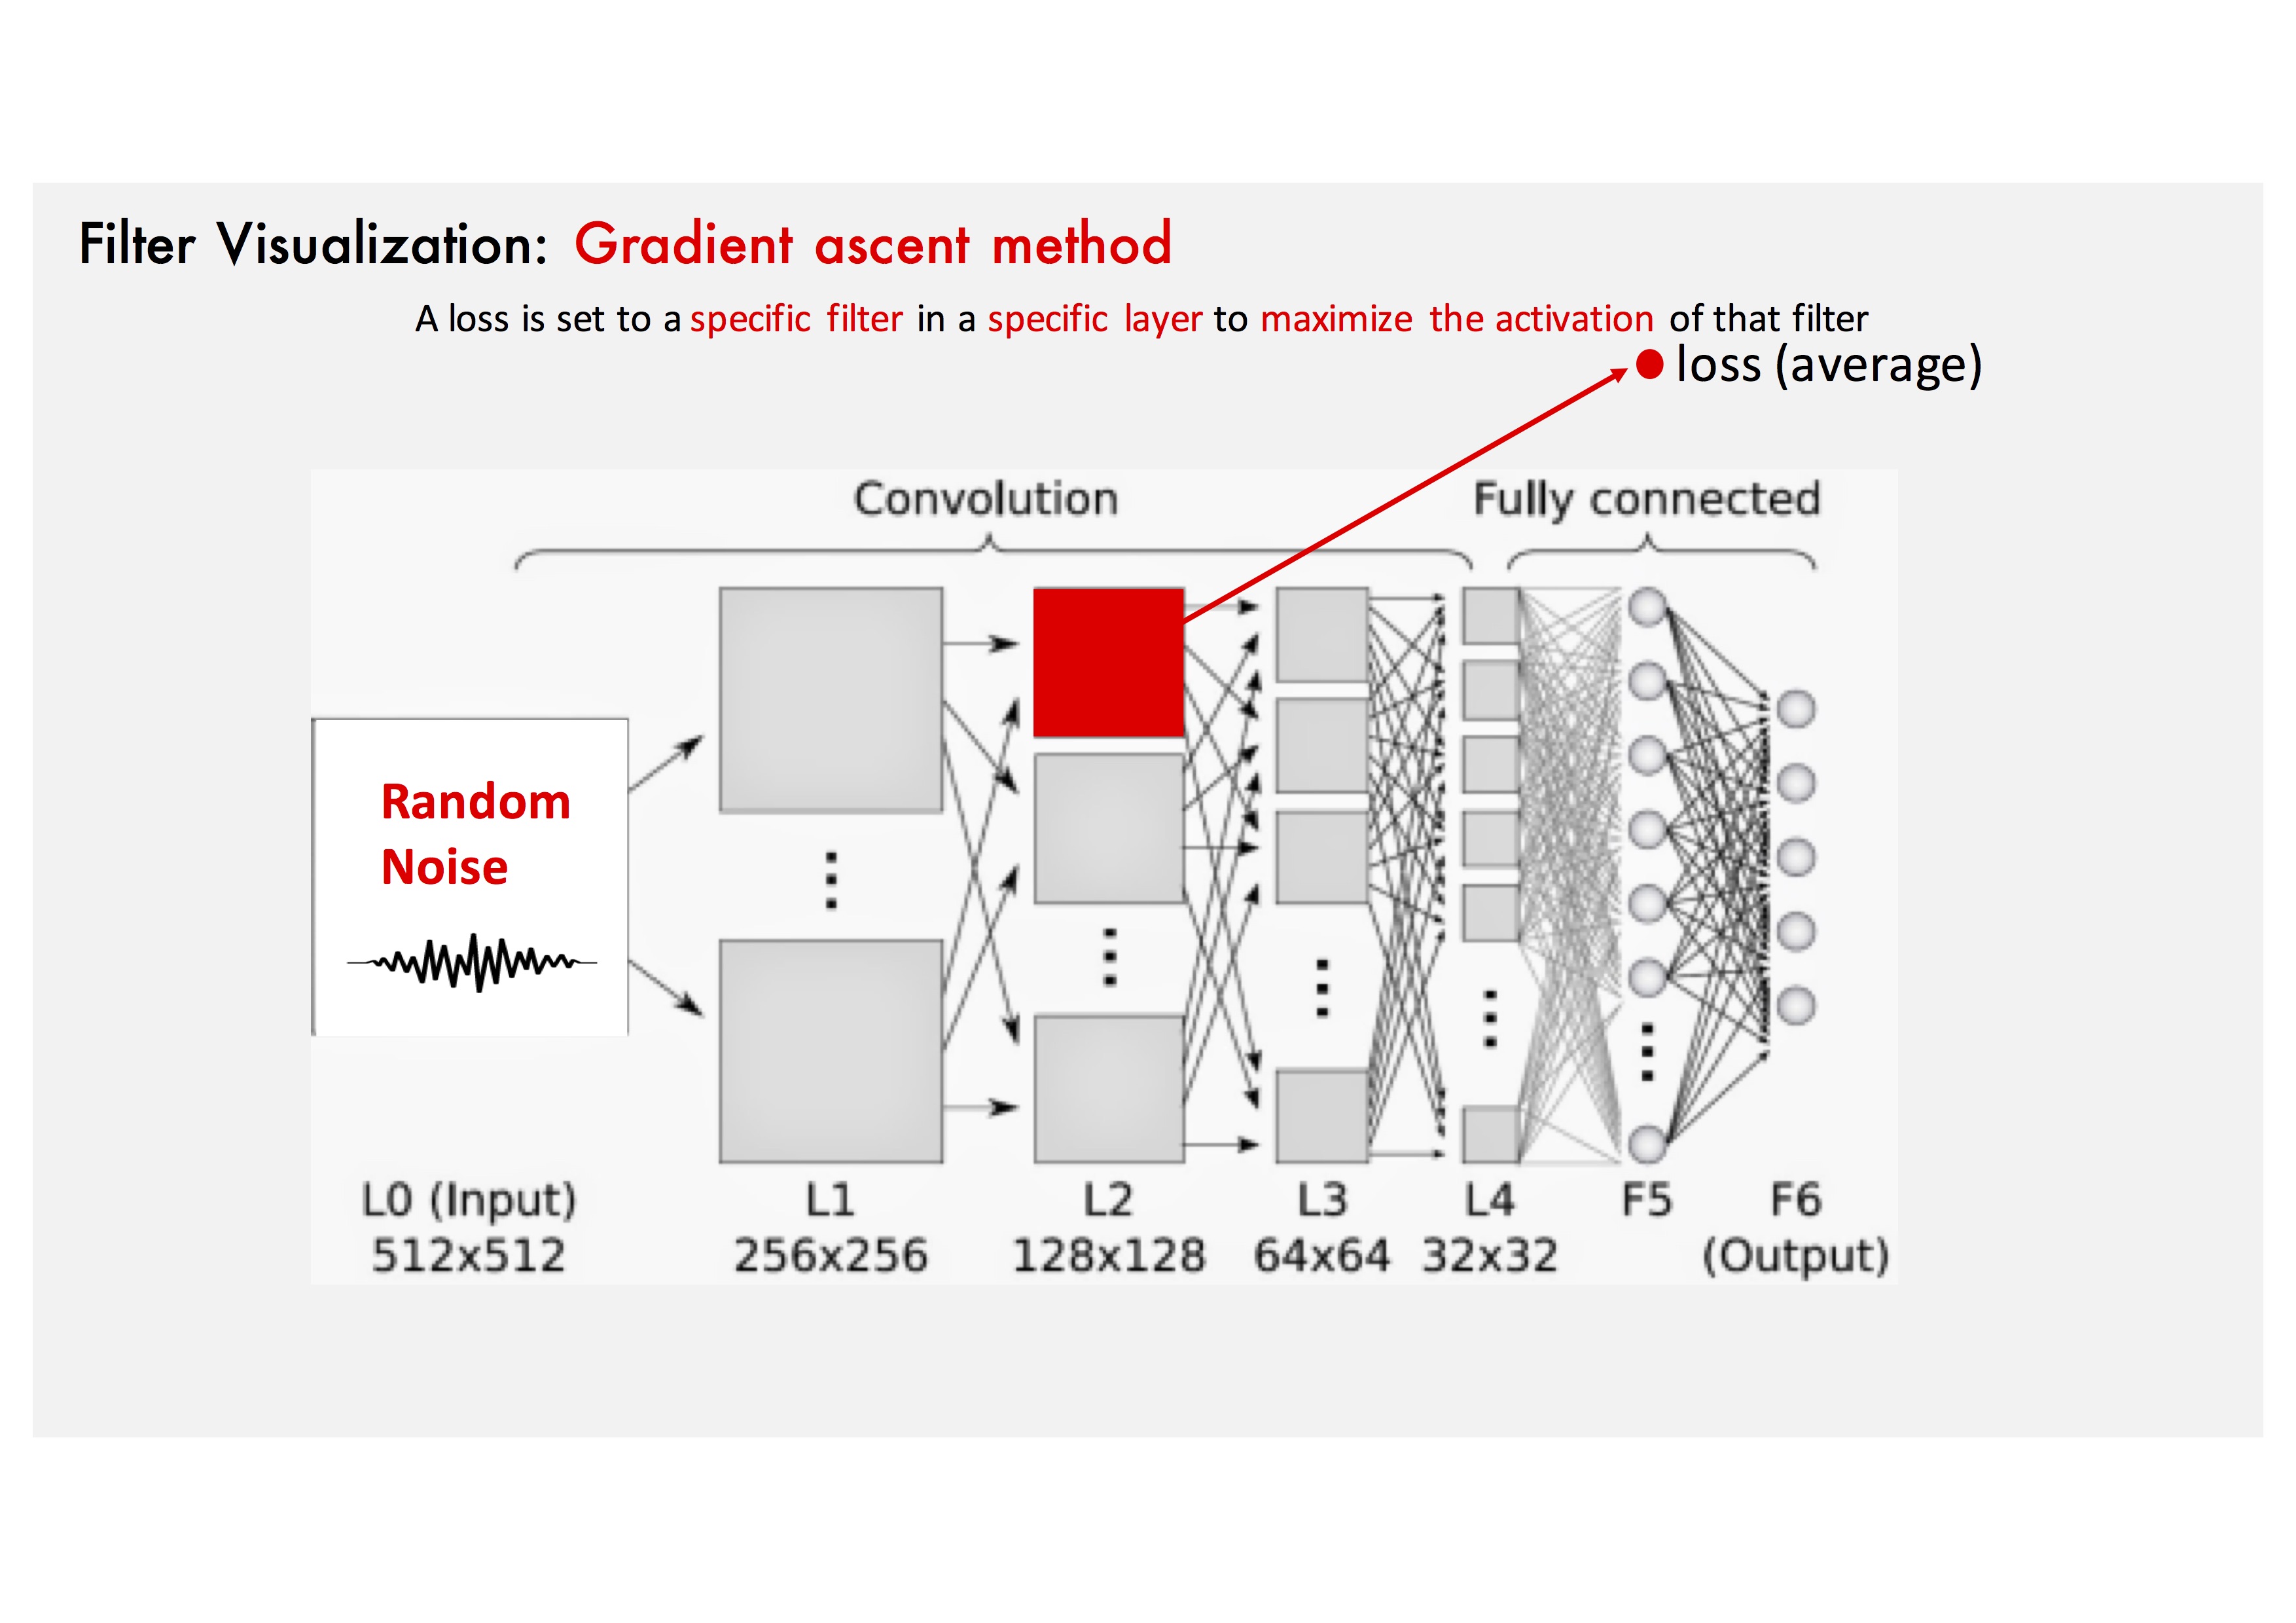
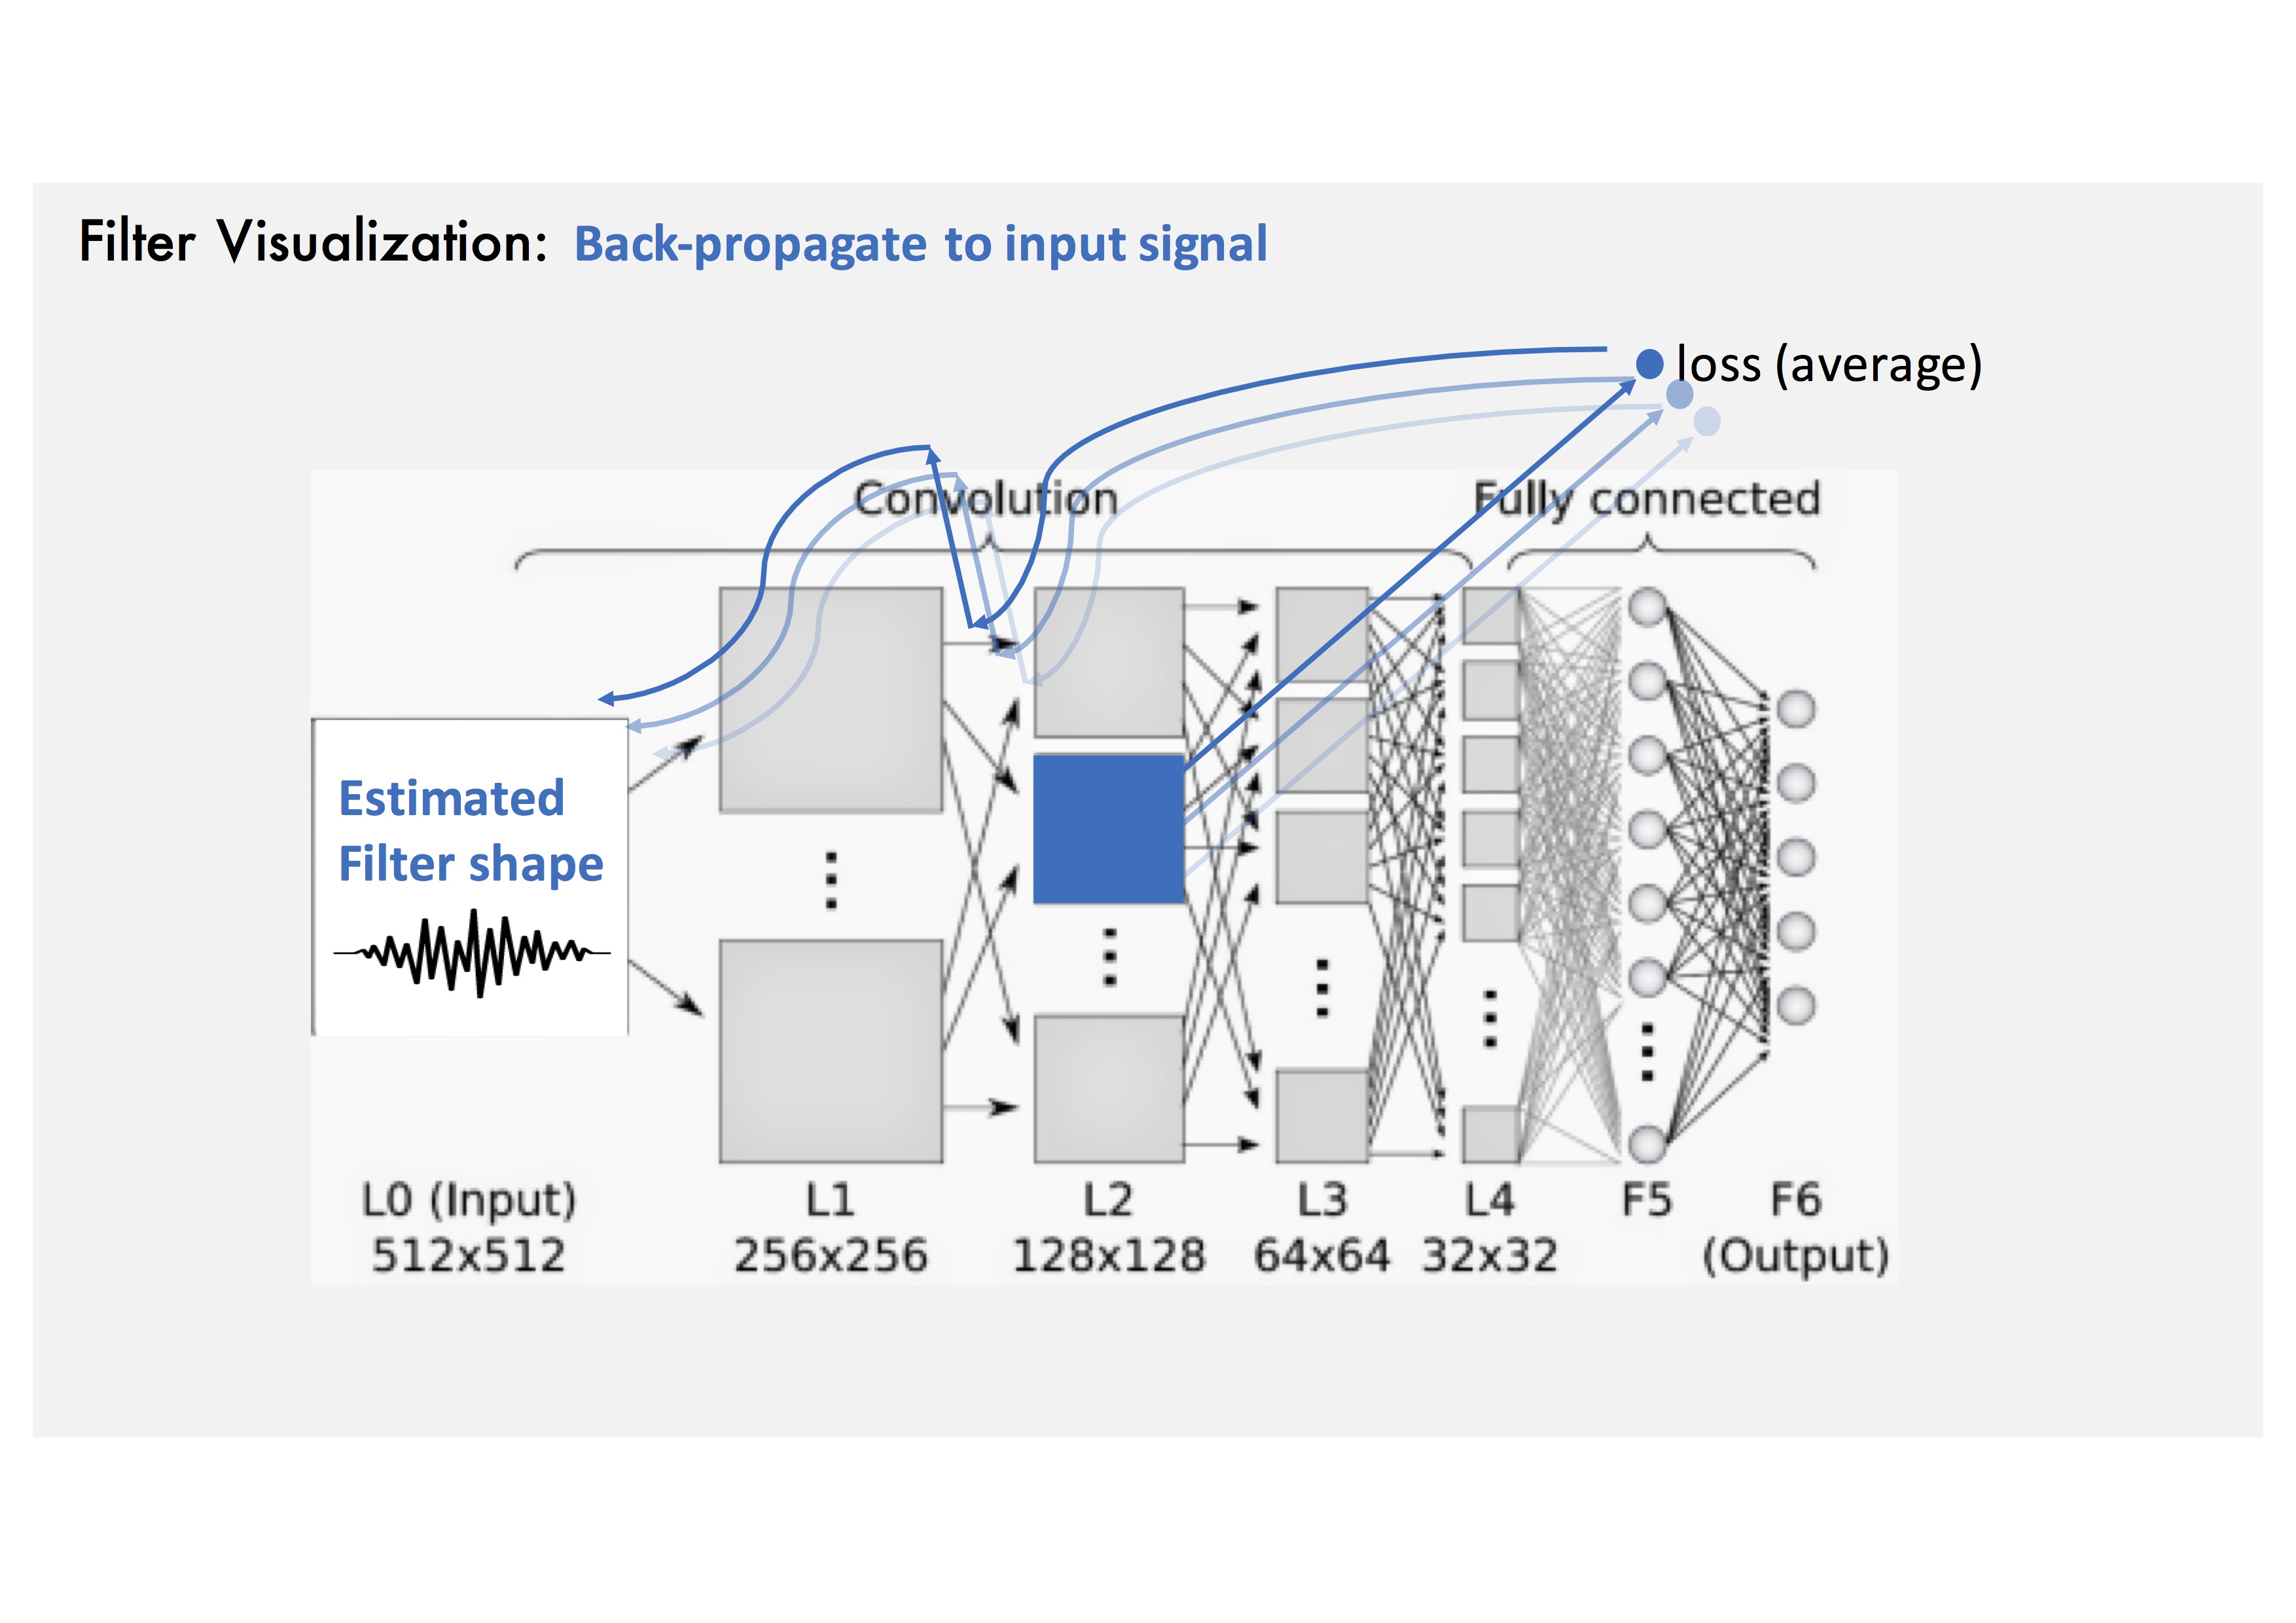
Gradient Ascent Method: Convolution operation.
Gradient Ascent Method: Loss is set to target filter to maximize the activation of the estimated filter shape.
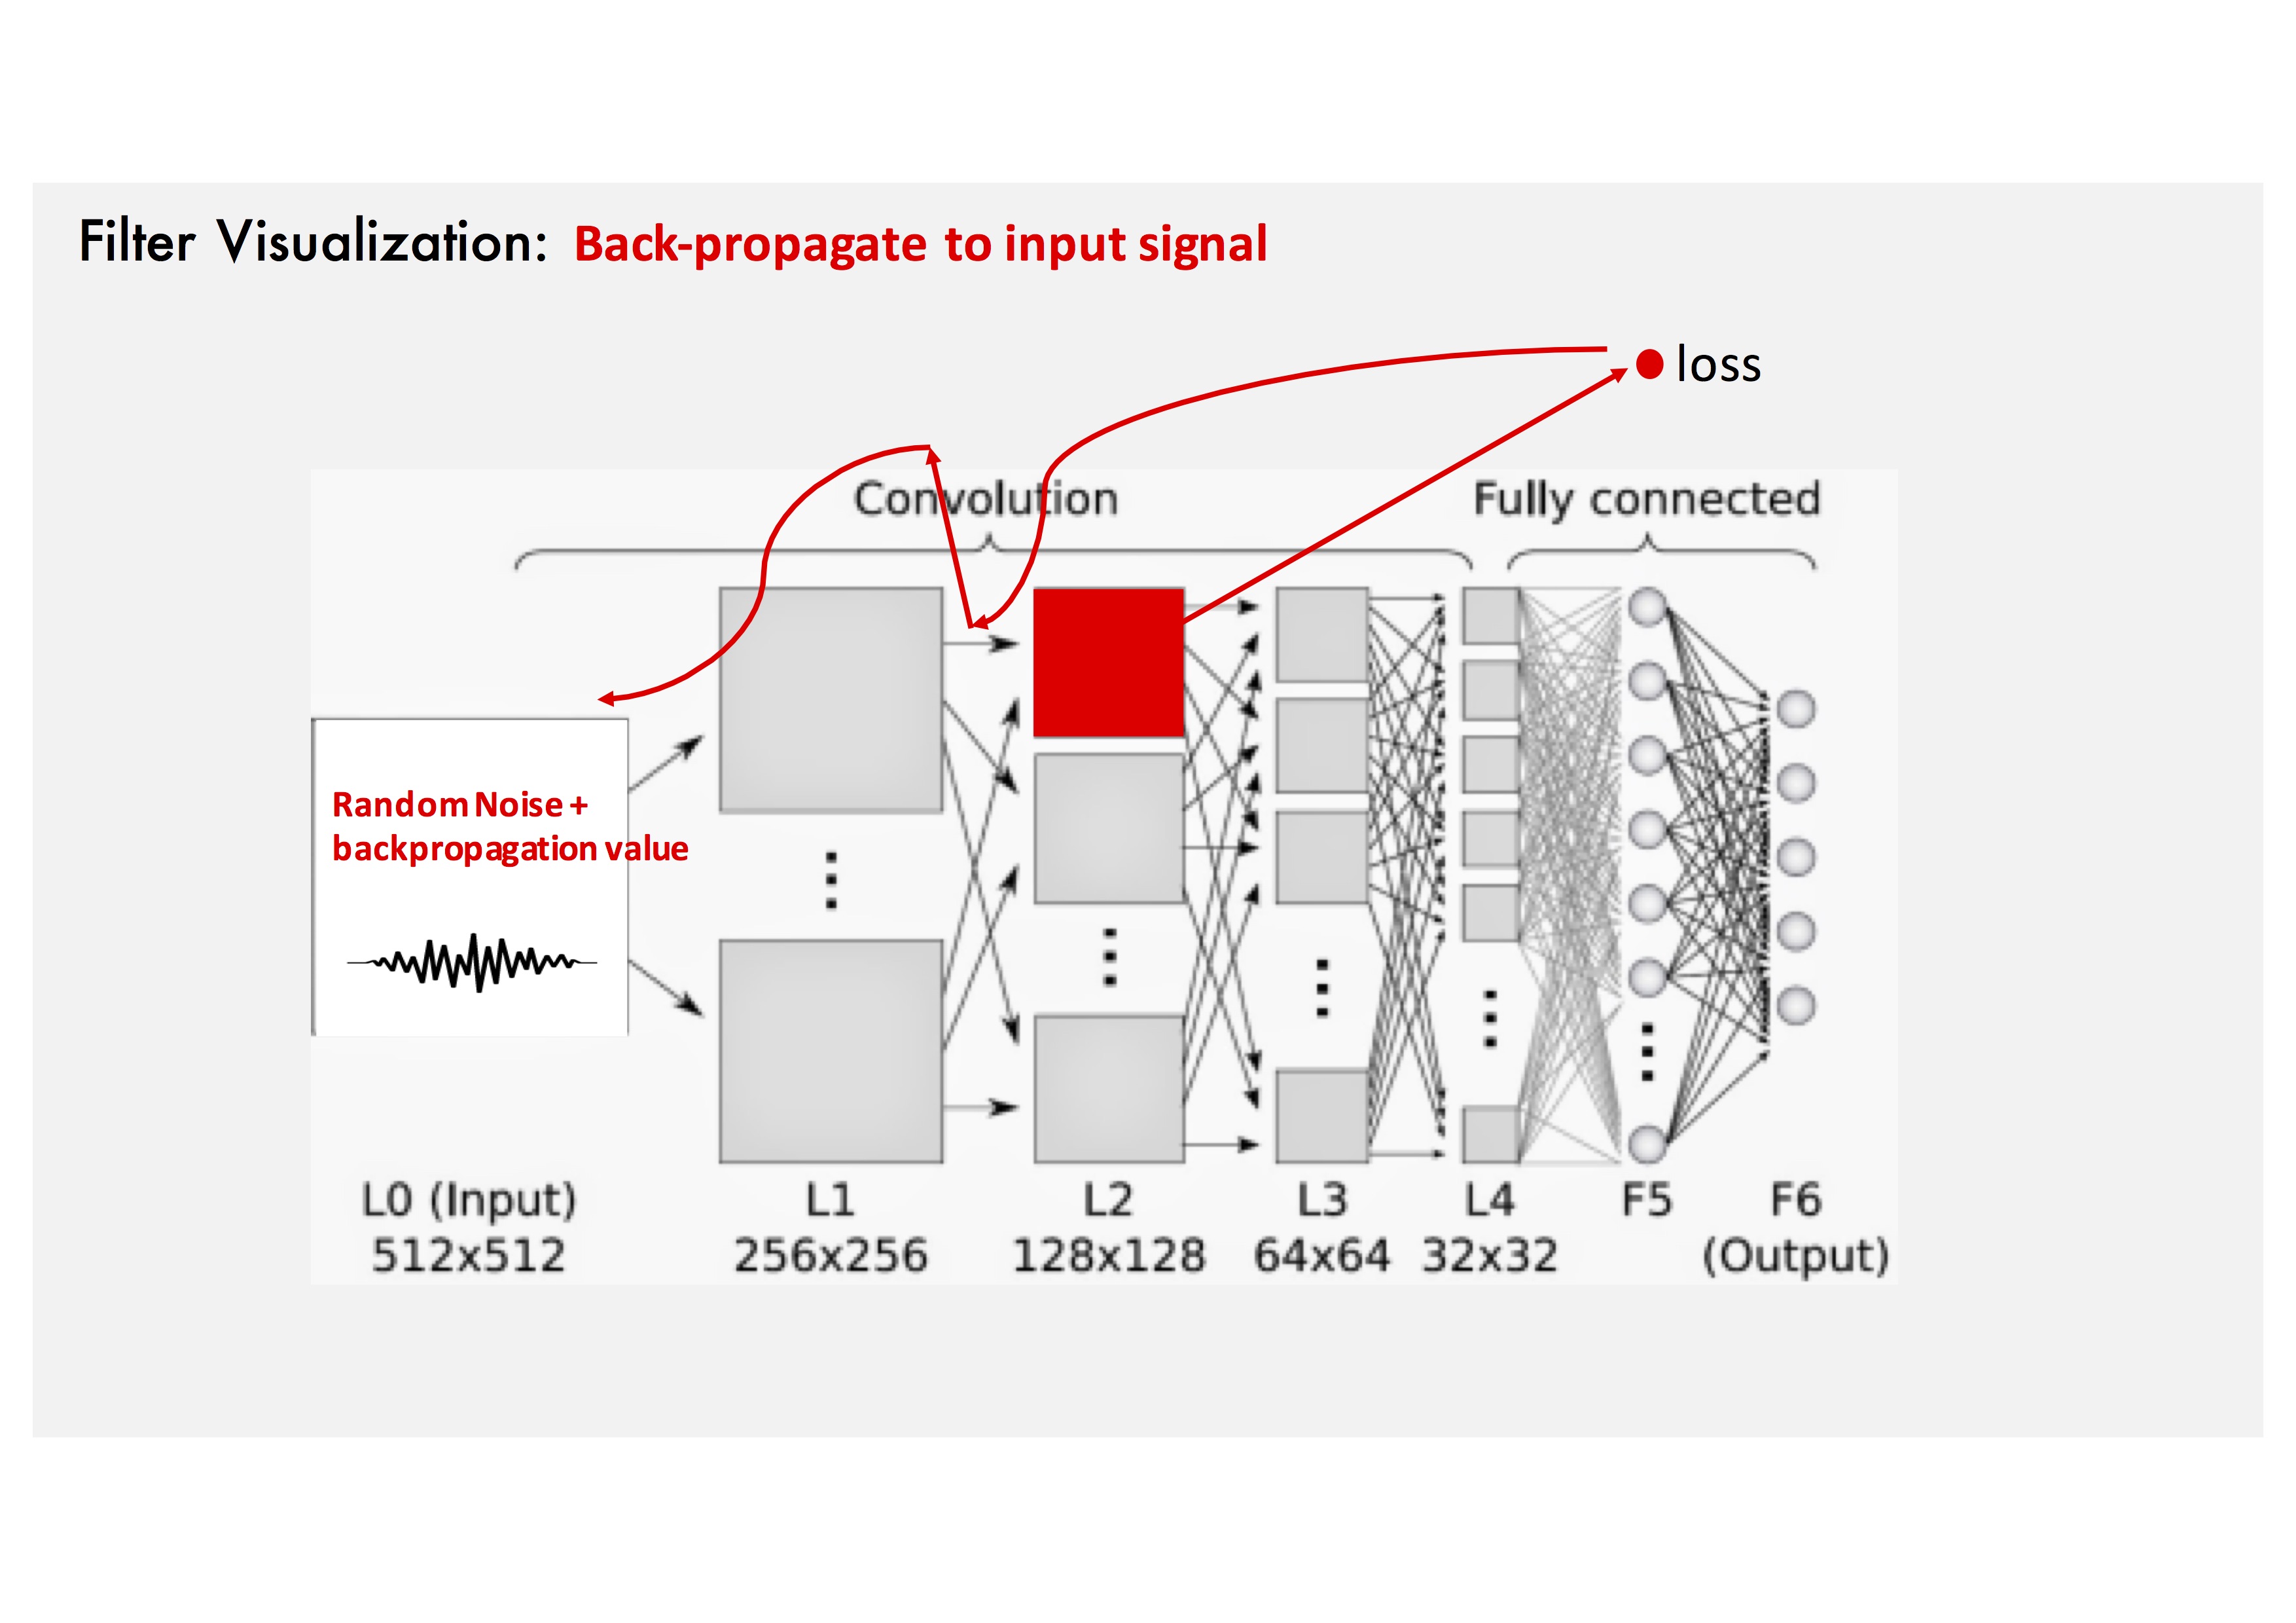
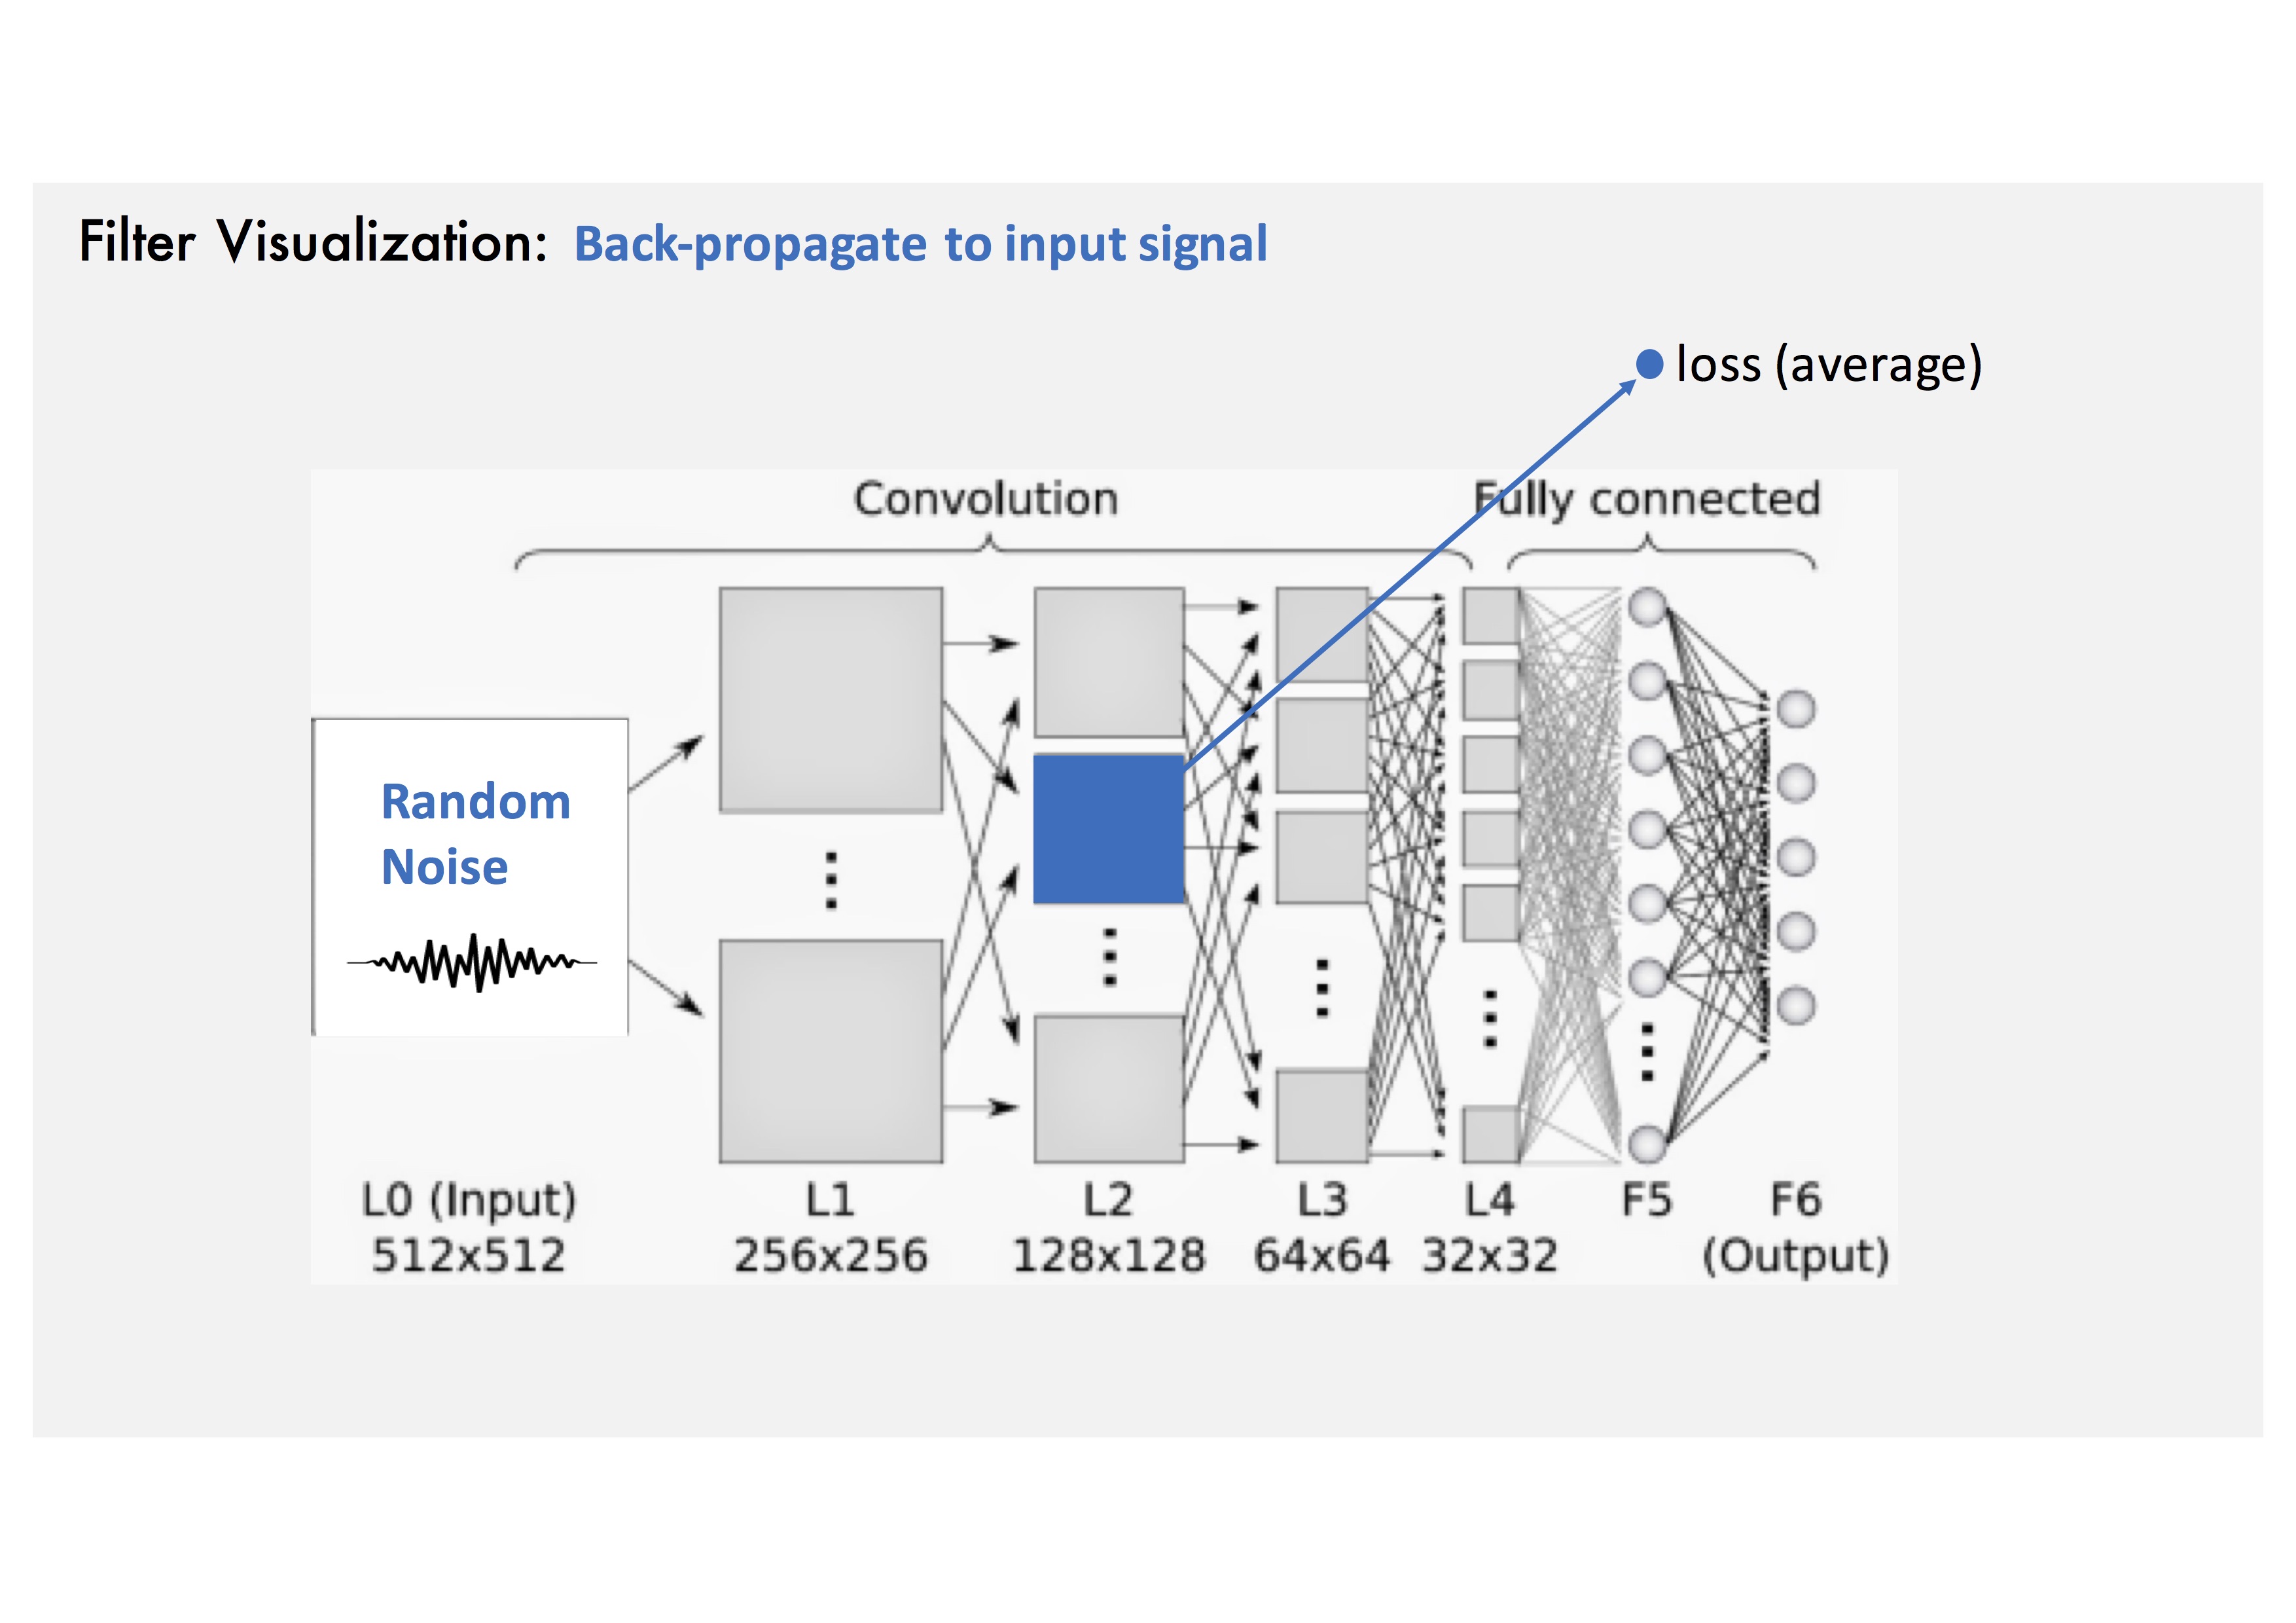
Gradient Ascent Method: Add the back-propagated value to input noise.
Gradient Ascent Method: Repeat several steps.
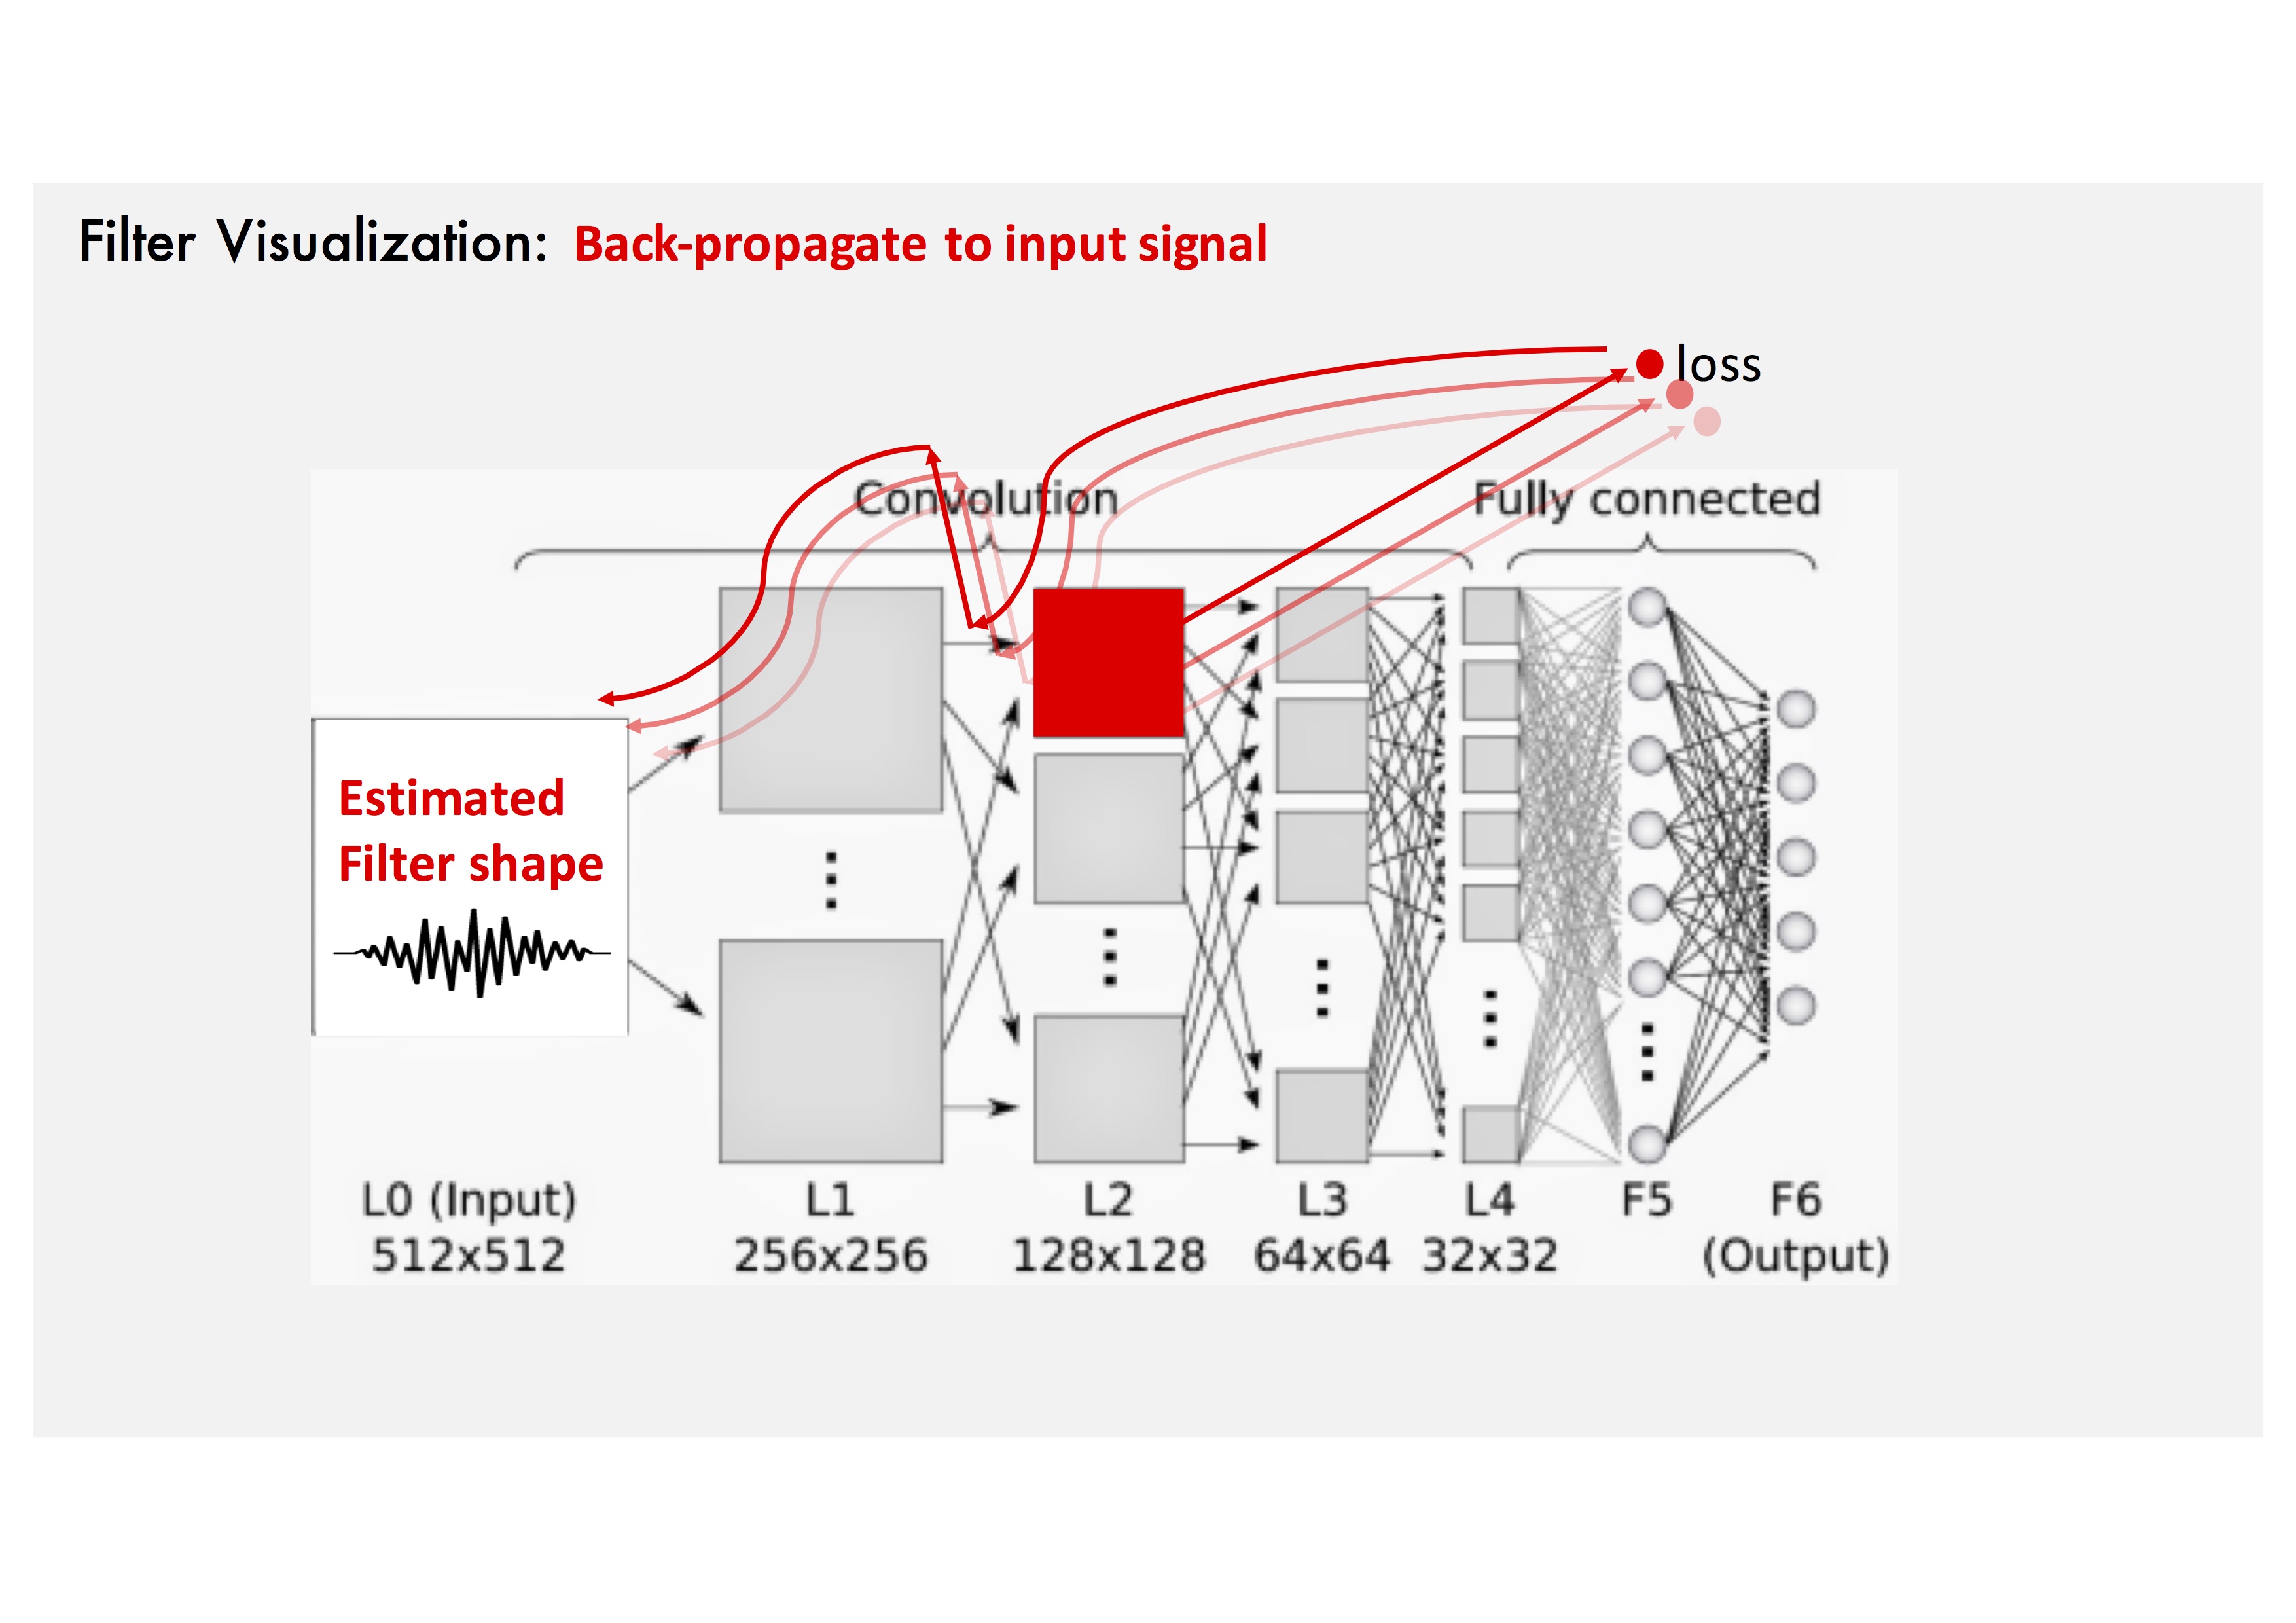
Gradient Ascent Method: Run the same steps for different filters.
Gradient Ascent Method: The filter shape estimate is obtained at the input signal.
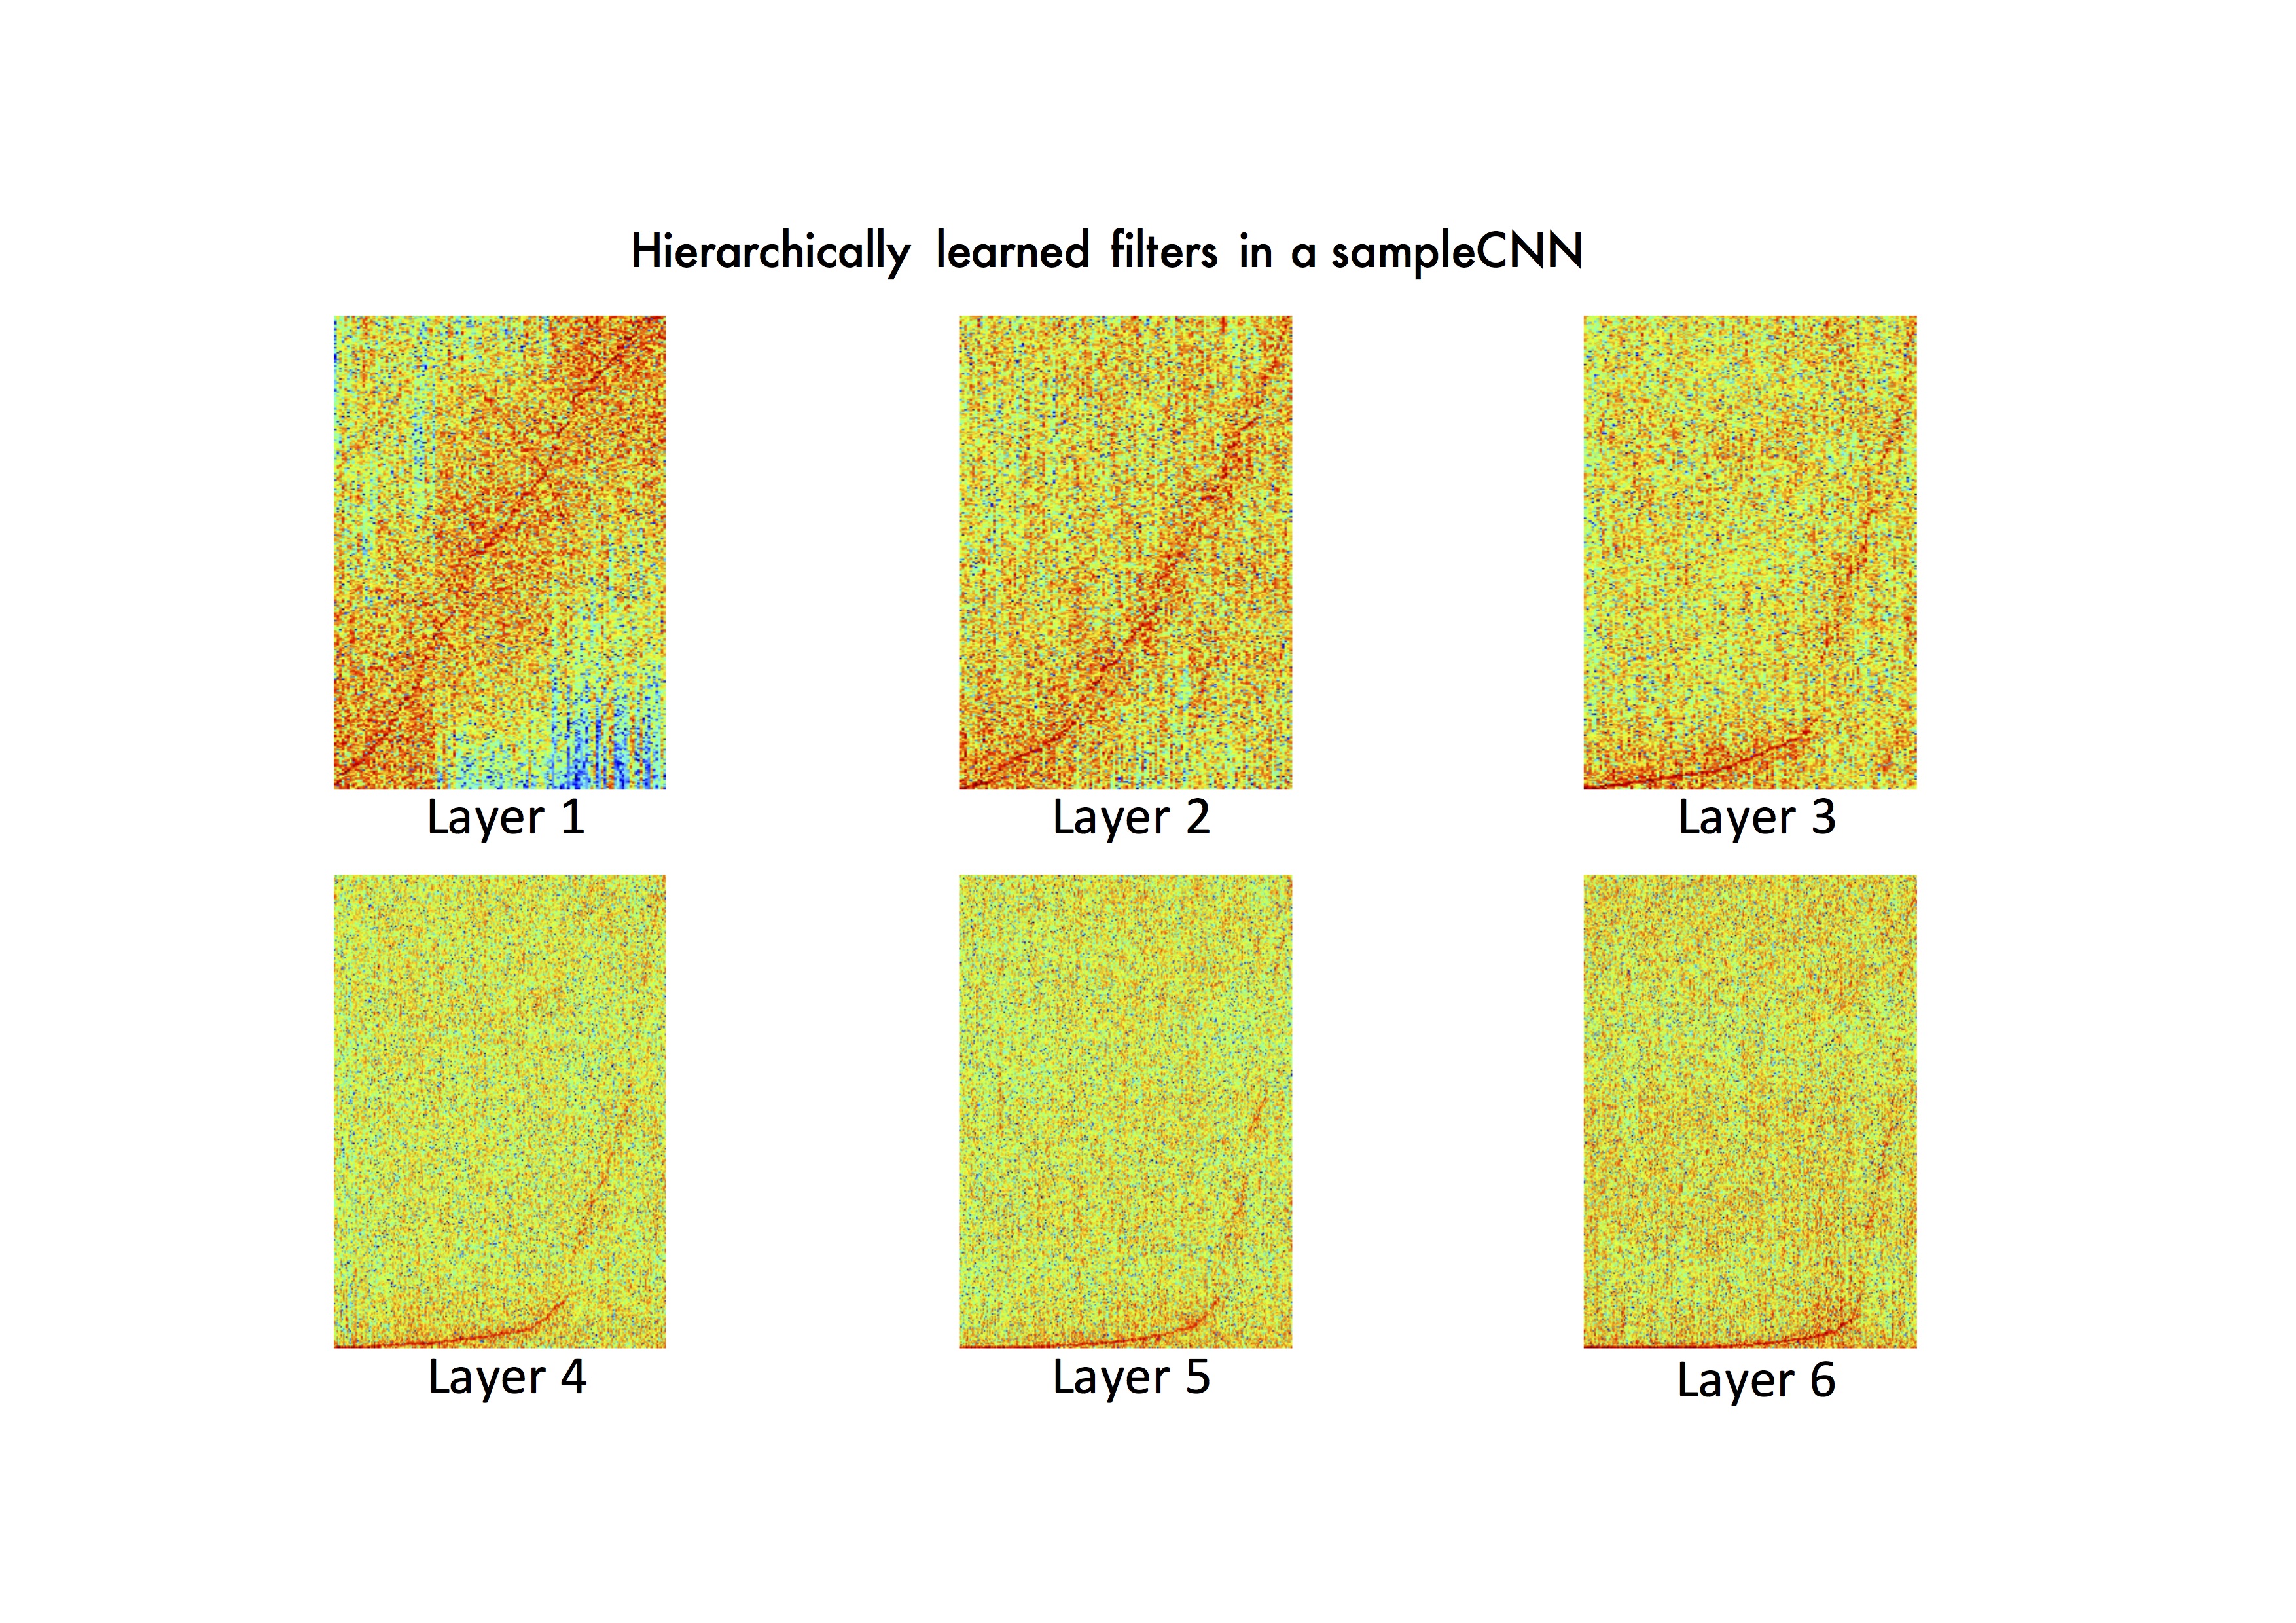
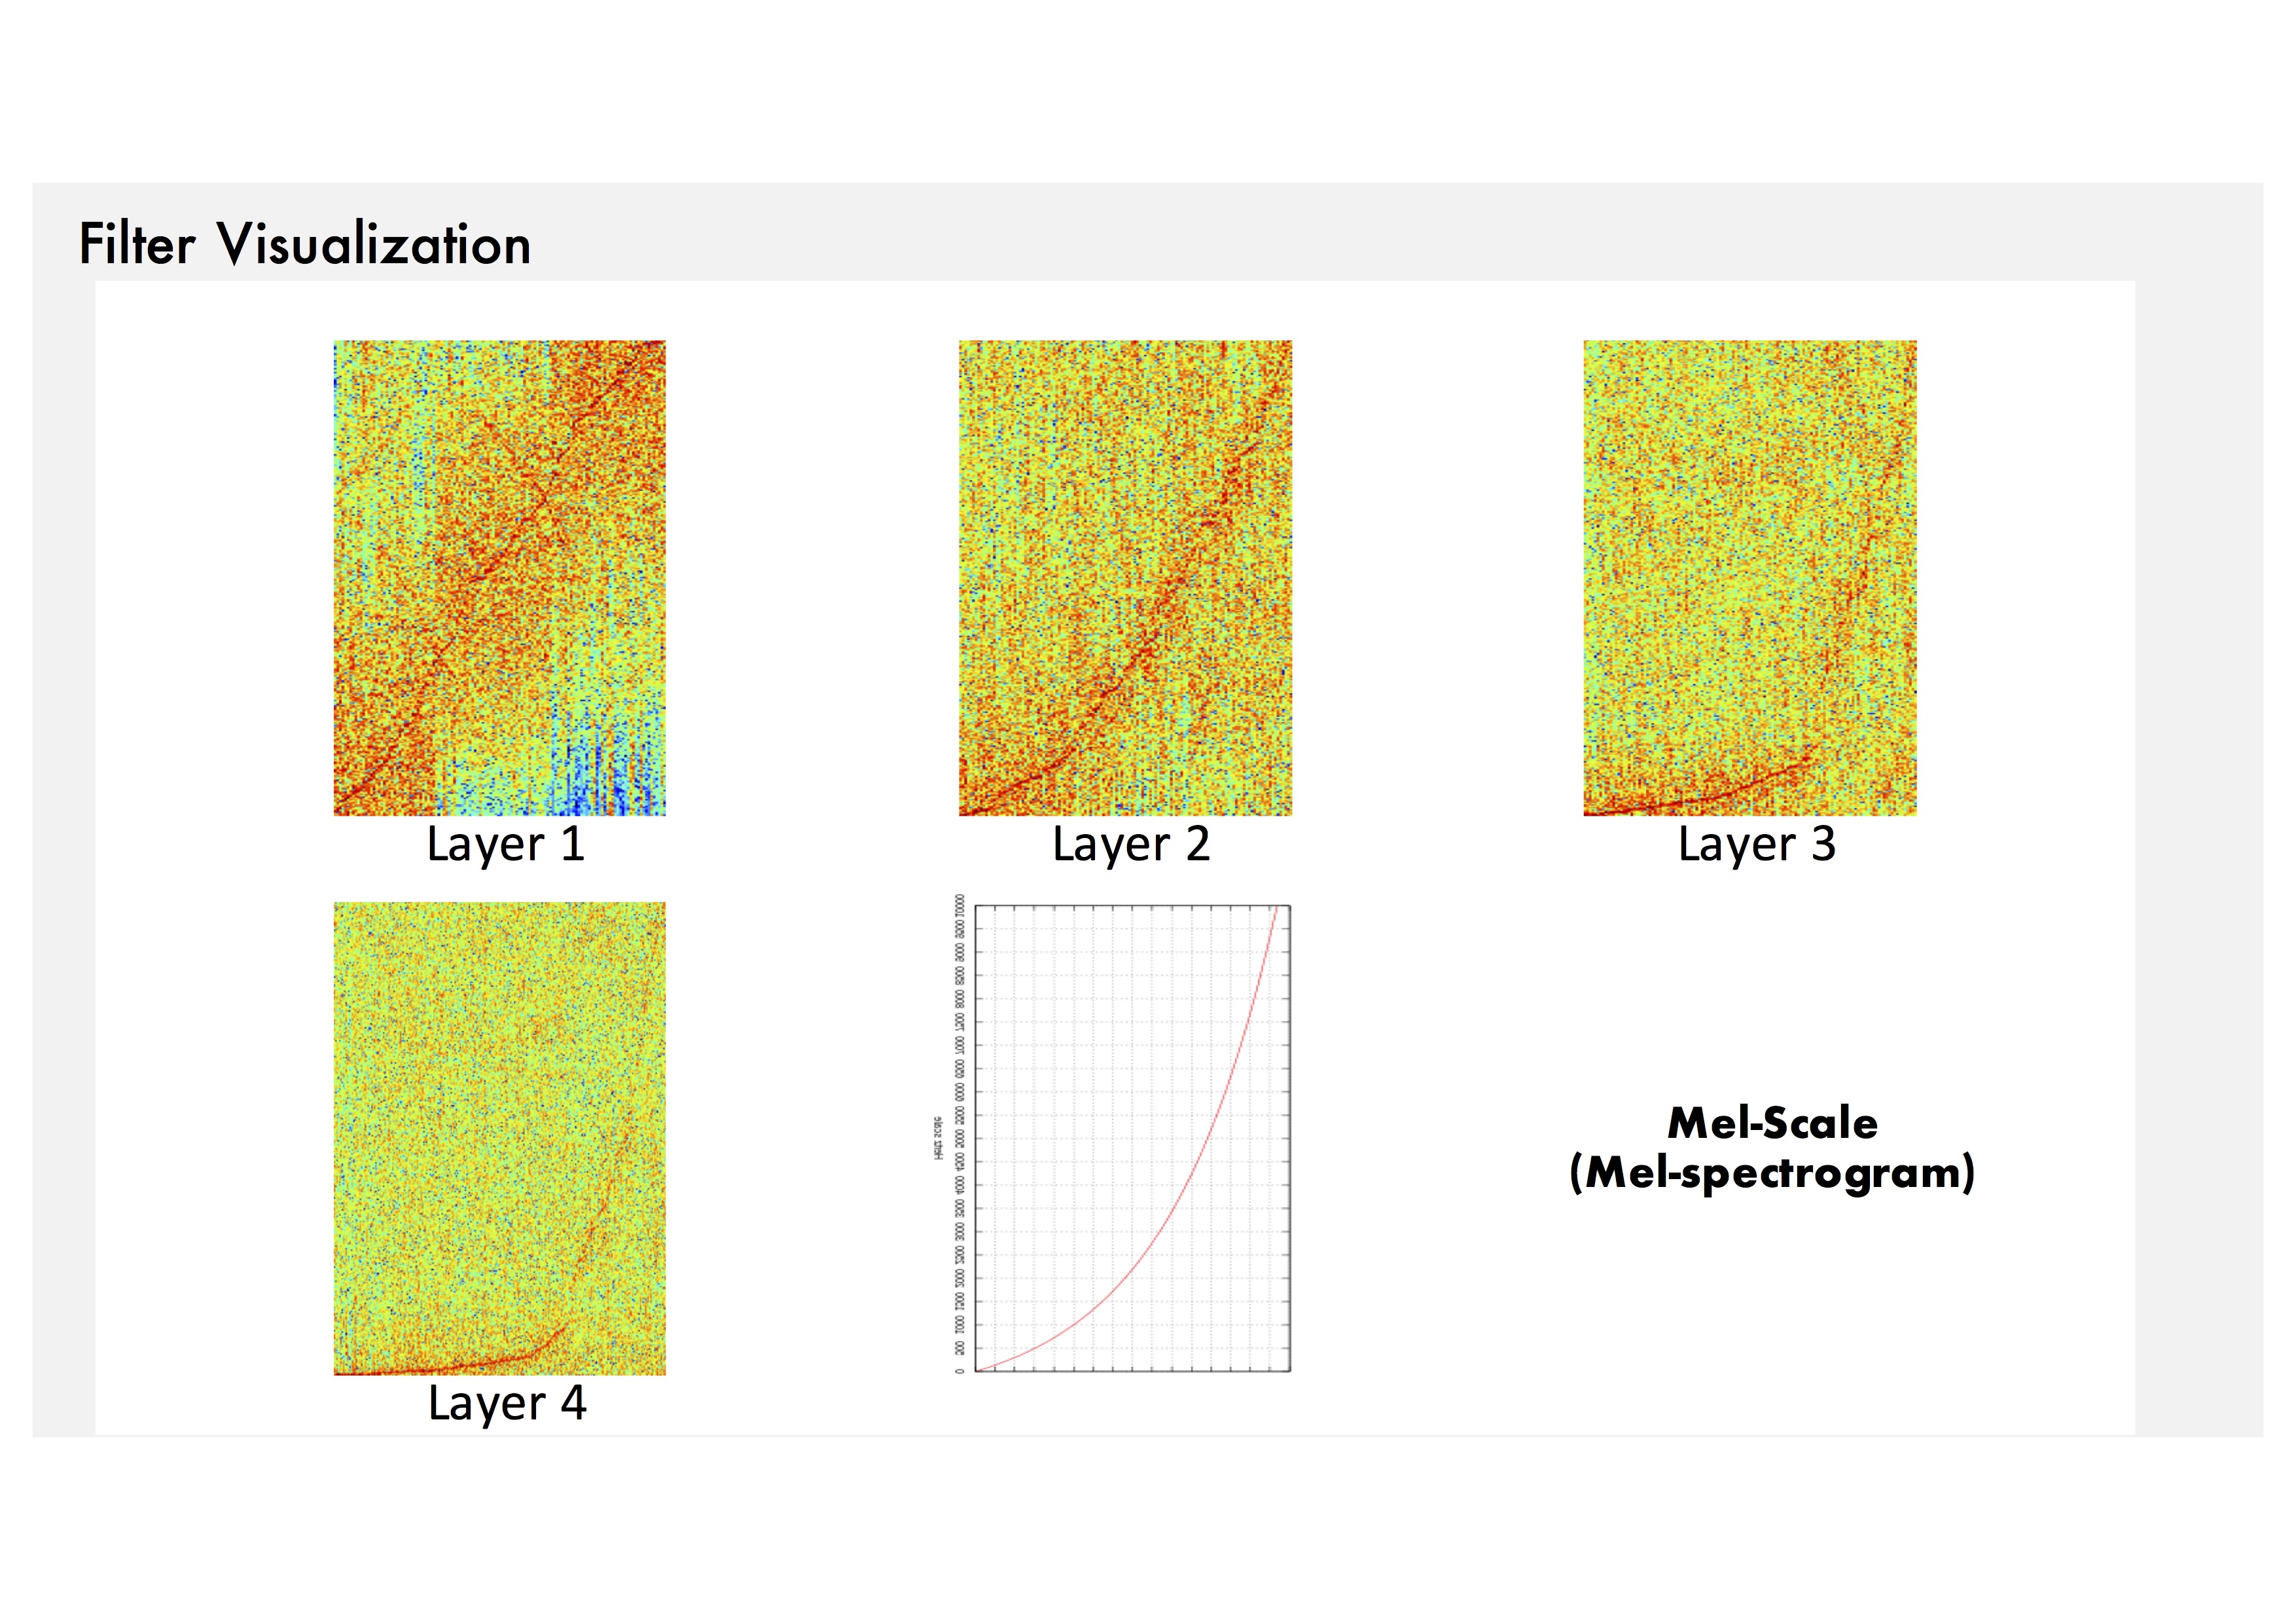
Filter Visualization: To show the spectrums effectively, we use typical frame-size input (e.g. 729 samples).
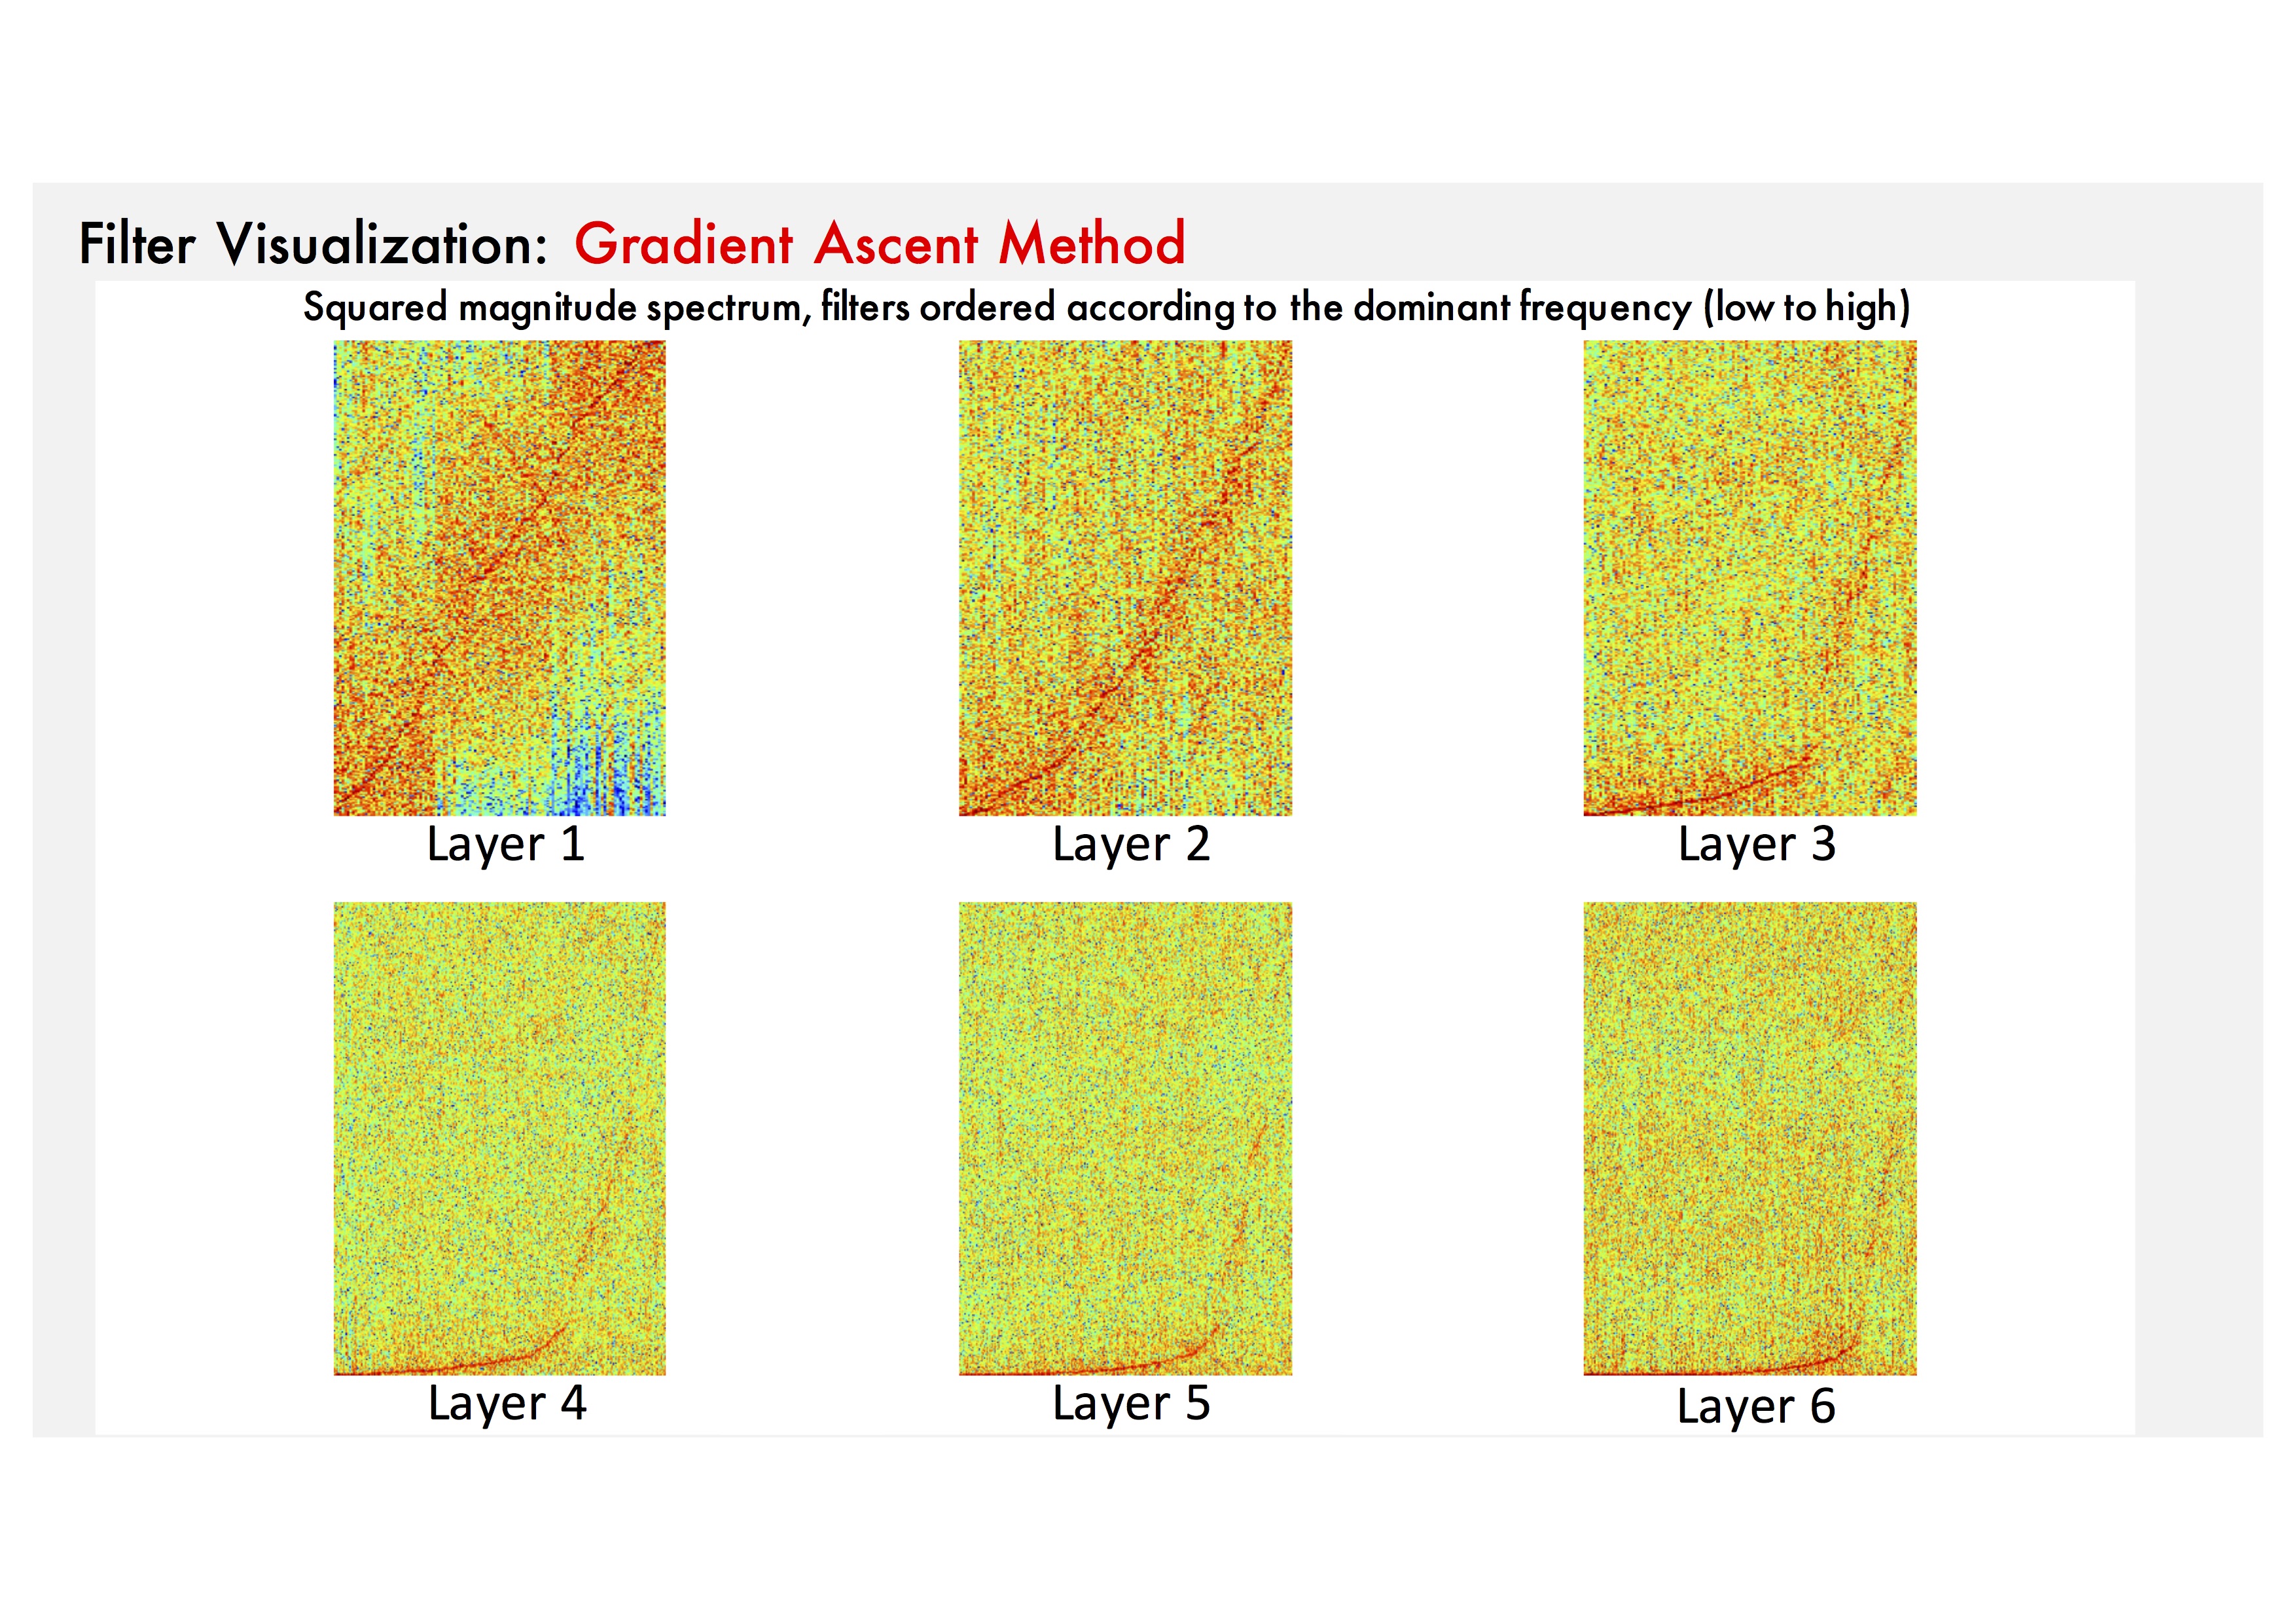
Filter Visualization: We can see that they are sensitive to log-scaled frequency
along layer, such as mel-frequency spectrogram that is widely used in music classification systems.
Check out the paper for more info.